


An opening range breakout is the most popular strategy used by the day traders. Today, we’ll look at what it is and how to trade it.
Contents
- What is an Opening Range?
- Opening Range Breakout
- Opening Range Breakout Strategy & How to Backtest it
- How to Calculate and Identify Opening Range Breakout?
- Ways to Trade the Opening Range Breakout?
- Takeaways
What is an Opening Range?
The Opening range of the day sets the tone for the rest of the day and to calculate it, we need to take the opening high and low, which can generally range from 15 minutes to 30 minutes or even 1 hour.
Also, the previous day’s high and low are important price zones that also need to be taken into consideration while calculating the range.
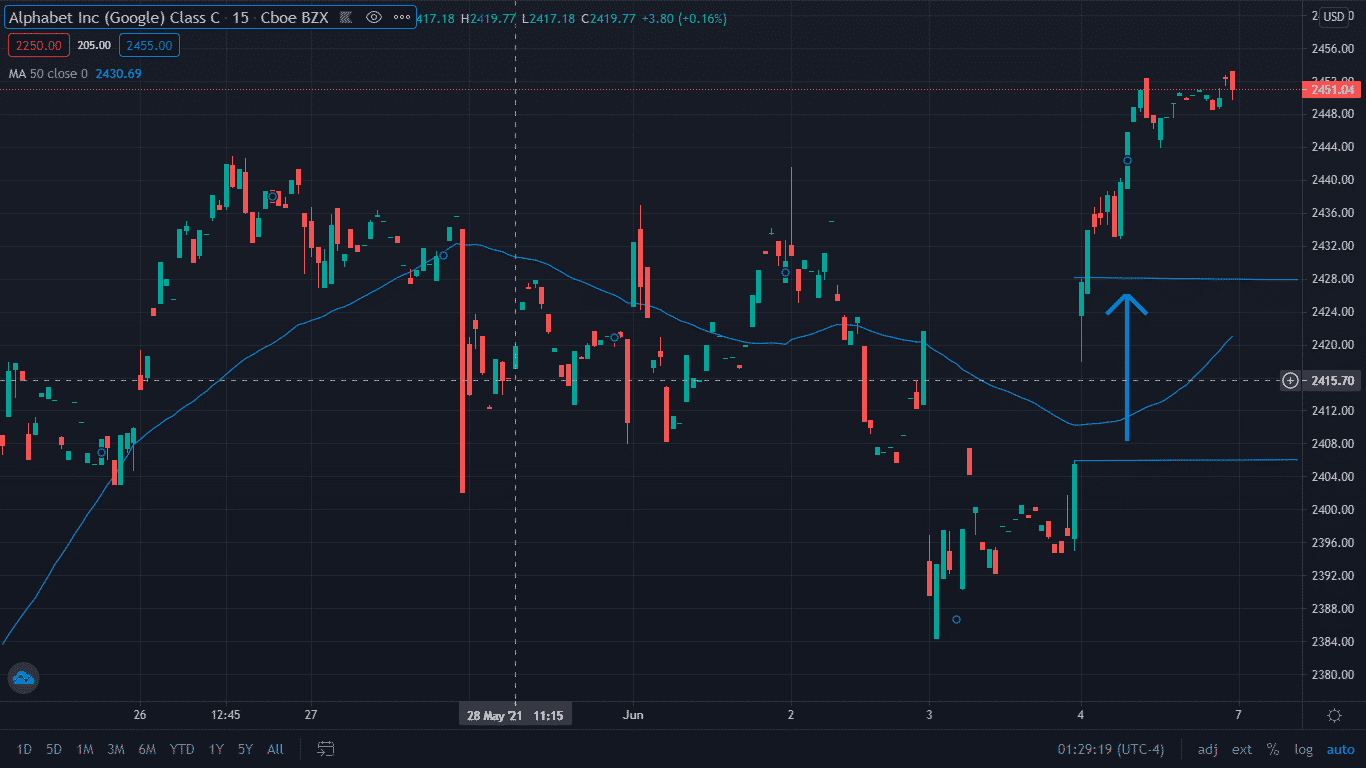
The chart below is of Alphabet (GOOGL).
On June 4th, 2021, the stock opened with a bullish gap and formed a high of $ 2,428.19 in the first 15-min timeframe as against the previous day’s close of $2406.
So, we can determine the opening range as $ 2,406 – 2,428.19 as indicated by the arrow in the chart.
What is an Opening Range Breakout (ORB)?
An opening range breakout can be defined as the breakout of the price from its opening range to continue its movement in that direction.
For example, after breaking the high of the range, the price continues moving higher.
If the stock breaks the low of the range, it comes under selling pressure.
The trading of the opening range breakouts gives fixed entry and exit points and the stop-loss can be determined by the trader based on his risk exposure.
Opening Range Breakout Strategy & How to Backtest it.
Per this strategy, the trader goes long or short on a stock when the high or low as determined by the opening range is broken.
Such a strategy might seem to be simple, but it needs a lot of optimizations that can be achieved by backtesting.
The backtesting of a strategy develops trust, and it must be done over the past several years of data to streamline and improve the parameters for the strategy such as: –
- Picking the timeframe to be used for determining such a range which can be from 15 min to 30 min or even 1 hour.
- The entry point after the breakout which can be the close of the candle or waiting for a pullback candle to initiate the trade.
- The minimum target for the trade which can be say, the length of the range.
- A stop-loss which can be set as half of the target keeping the risk-reward ratio in mind.
- The exit criteria which can be a break of a trendline/or break of a 5-day SMA or VWAP.
- Other parameters such as minimum volume criteria for initiating a breakout trade.
The backtesting optimizes the parameters for the strategy and sets the tone for the trading set up in the live market.
How to Calculate and Identify an Opening Range Breakout
Calculating the breakout is the most important part of such a strategy.
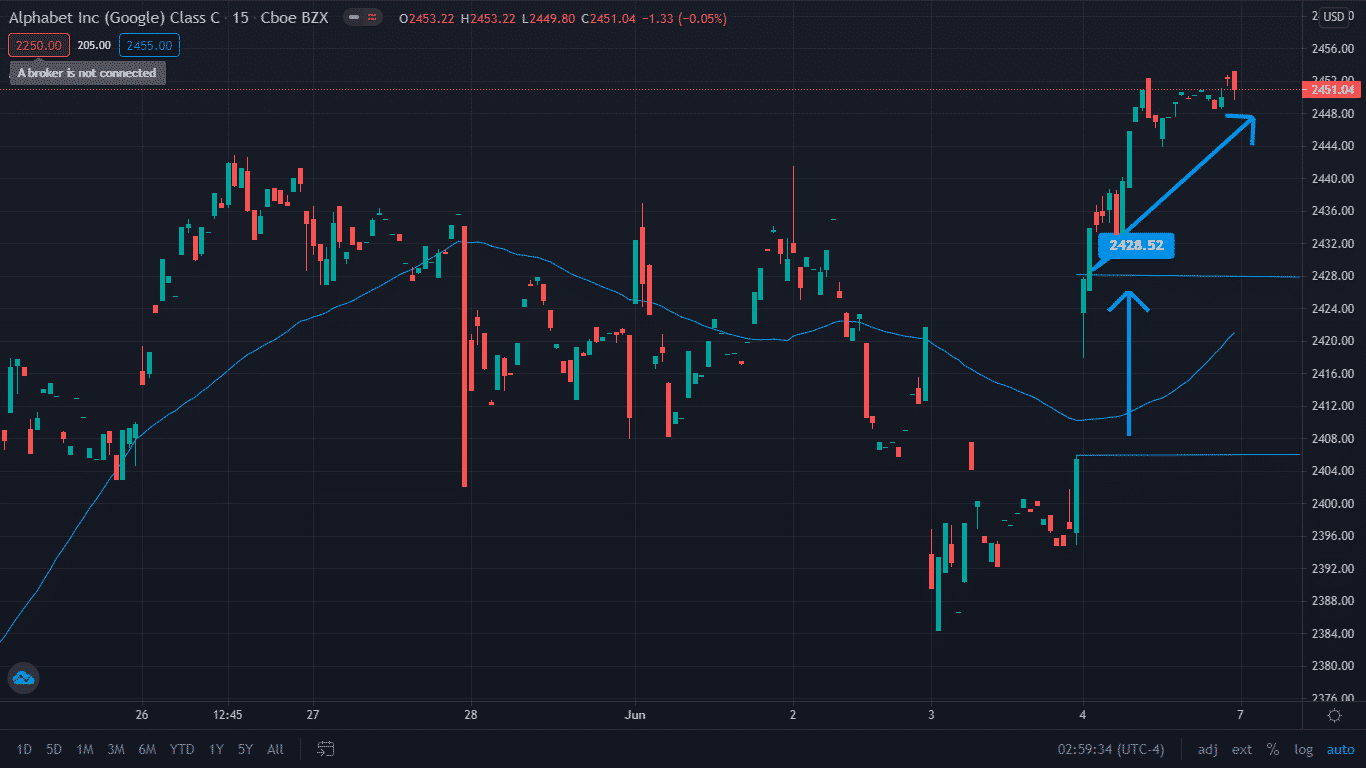
The below chart of Alphabet Inc Class A (GOOG) reveals that after breaking out from the high ($ 2,428.19) of the range, the price shoots up to $ 2,453.
It is also important to identify an actual breakout and not get trapped by false breakouts.
The chart below is of “American Eagle Outfitters (AEO) which opened with a gap up on May 26th, 2021 and the opening range was determined as ($33.27 – 35.32) on a 15-min timeframe.
Subsequently, the price tried to break the opening range but failed in its attempt as the on lower volume. The false ORB resulted in a sell-off from that price level.
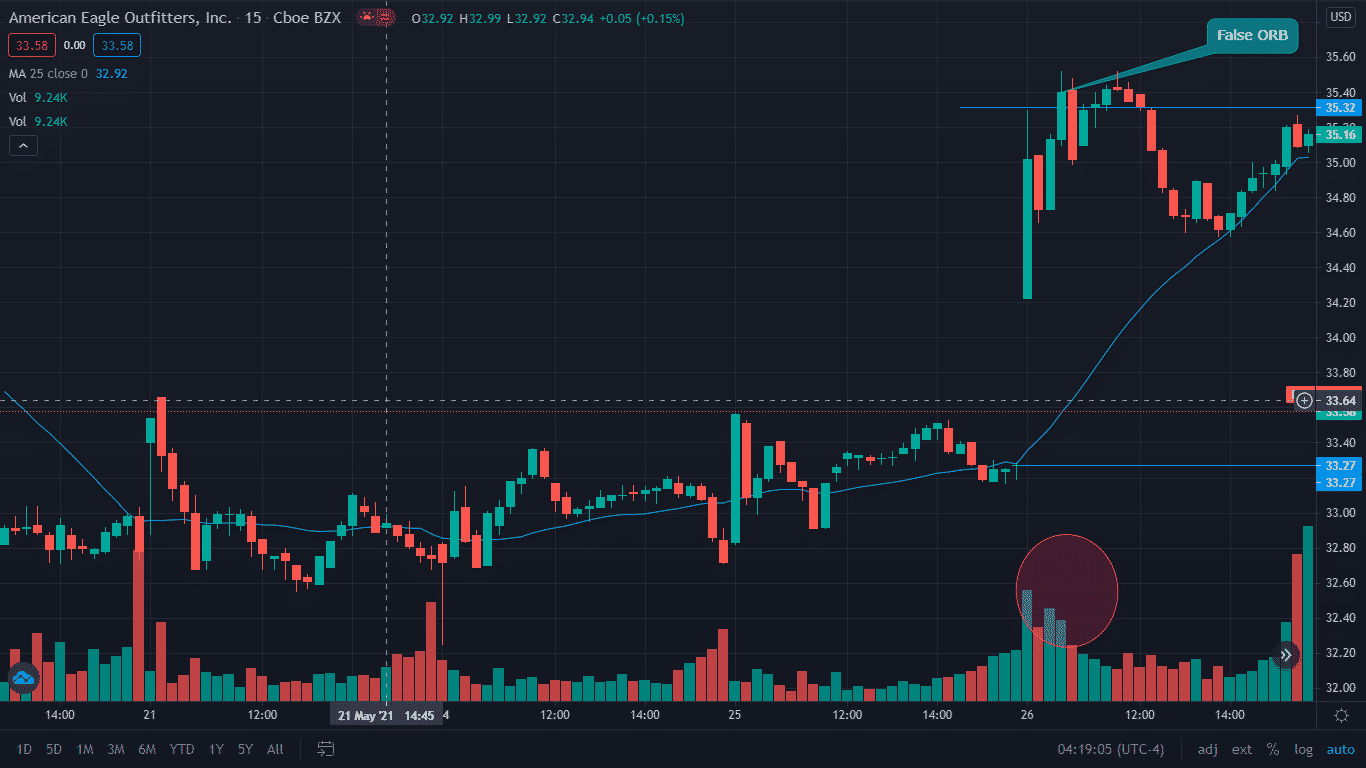
While trading the ORB, it becomes imperative for the trader to identify the false breakouts and avoid entering into such trades.
The various parameters such as moving average, VWAP, volume, etc. can come in handy to identify and trade ORBs with good volume.
How to Calculate and Identify an Opening Range Breakout
While trading ORB, the entry, stop-loss, target, and exit become vital for traders so they can gain ride the momentum after the trade has turned profitable.
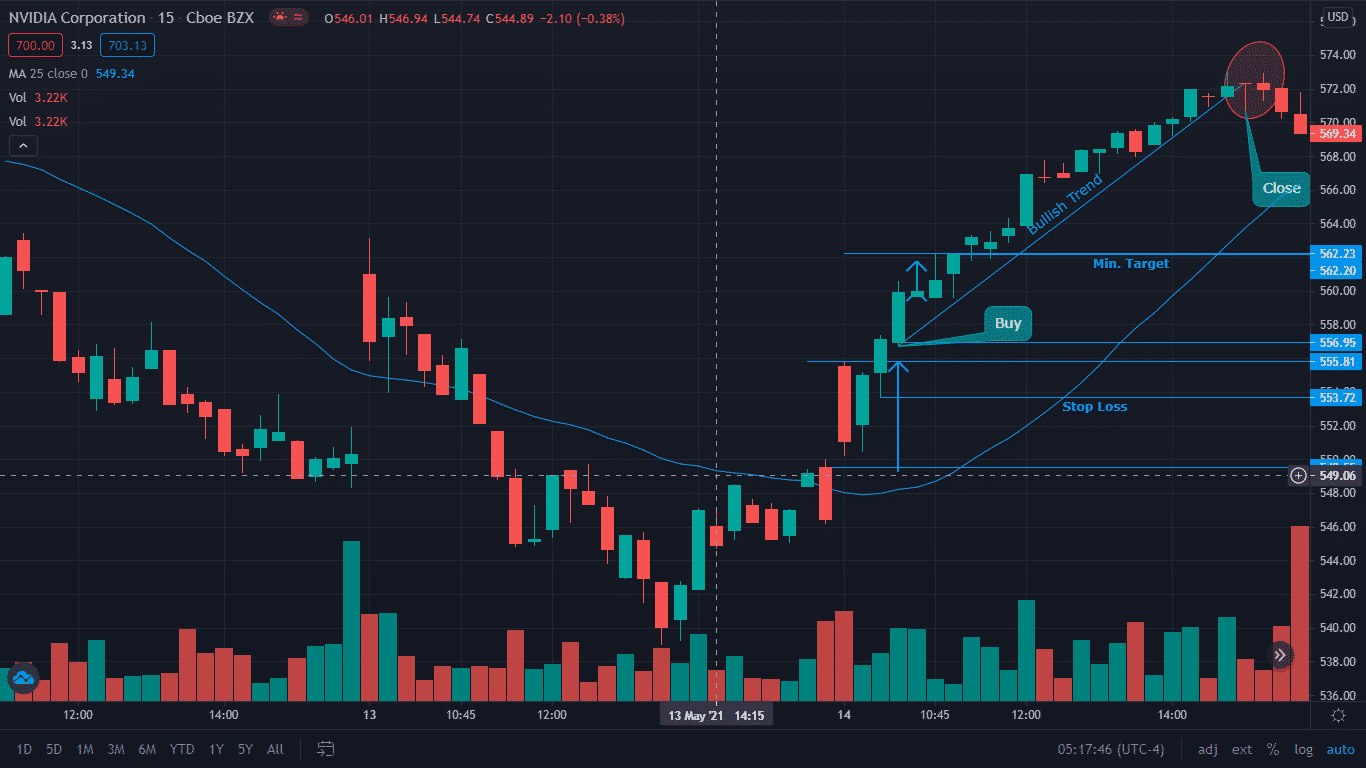
The below chart is of Nvidia Corporation (NVDA) on May 14th, 2021.
The opening range defined for the day would be ($549.55 – 555.81) on a 15-min timeframe.
Traders can go long when the price breaks the range at the close of the third 15-min candle at $ 557 with a stop loss at $ 553.72 and a minimum target of $ 562 with a risk-reward ratio of more than 1:1.
Since, after the breakout, the trend continues to be bullish and the trader can very well ride the momentum by using the bullish trendline as his exit criteria to continue the profitable trade, and thus his exit will be around $ 570 with the break of the trendline.
The ORB strategy with a good breakout often gives an incredibly good reward vs the risk. Traders can use additional parameters to increase their chance of success.
Key Takeaways
Trading breakouts of opening range involves various steps such as: –
- Identifying the range at the opening of the markets.
- Formulating a breakout strategy after backtesting it with optimization of different parameters.
- Identifying false breakouts and avoiding them.
- Recognizing good ORB trades and initiating a trade.
- Riding the profitable ORB trade or exiting with a small stop loss in case of no momentum or reversal after the breakout.
Trade safe!
Disclaimer: The information above is for educational purposes only and should not be treated as investment advice. The strategy presented would not be suitable for investors who are not familiar with exchange traded options. Any readers interested in this strategy should do their own research and seek advice from a licensed financial adviser.


