


Today we will discuss how to draw Fibonacci extensions. A technical analysis tool that many traders will find very useful.
Traders struggle to find the support or resistance level.
They use different parameters like moving average, VWAP, and Fibonacci levels to determine the target by identifying the demand and supply zone.
Fibonacci Extension is a vital tool to determine the target in an uptrend or downtrend of a stock.
Hence, today we will understand how to use it to set our targets.
Contents
- What Is Fibonacci Extension?
- How To Draw Fibonacci Extension?
- How To Use Fibonacci Extension To Trade
- Bottom line
What is Fibonacci Extension?
Fibonacci series is a sequence of numbers arranged in an order starting from 0 where the following number is the summation of the previous two.
The numbers are in the order 0,1,1,2,3,5,8,13,21,34,55,89,144,233,377,610 and so on.
Further, dividing any number with the previous one gives the golden ratio of 1.618, known as ‘Phi.’
610/377=1.618
377/233=1.618
Similarly, when any number in the series is divided by a number two places before it, it gives a ratio of 2.618.
Thus, for example, 610/233=2.618.
The unique consistency also emerges even when any number is divided by the number preceding three or four places.
It results in 4.236 and 6.86 ratios, respectively.
Fibonacci Extension is the tool to determine the targets after the price retracement using Fibonacci levels such as 61.8%, 100%, 161.8%, etc.
The Extension levels are the probable areas of price reversal with the possibility of solid demand and supply emergence.
How To Draw Fibonacci Extension?
You can draw Fibonacci Extension on any stock chart with the help of the tool “Trend Based Fibonacci Extension.”
The step below highlights the process for drawing the Fibonacci Extension.
- First, identify the two trends and select three points. The first and second points indicate the start and end of the primary trend. The secondary trend is the retracement of the first, and the third point is its endpoint.
- Select the Fibonacci Extension Tool and click on the three points mentioned above in sequential order.
The below is Apple Inc. (AAPL) weekly chart.
Points A and B represent the start and end of the primary uptrend, whereas point C is the end of the secondary retracement trend.
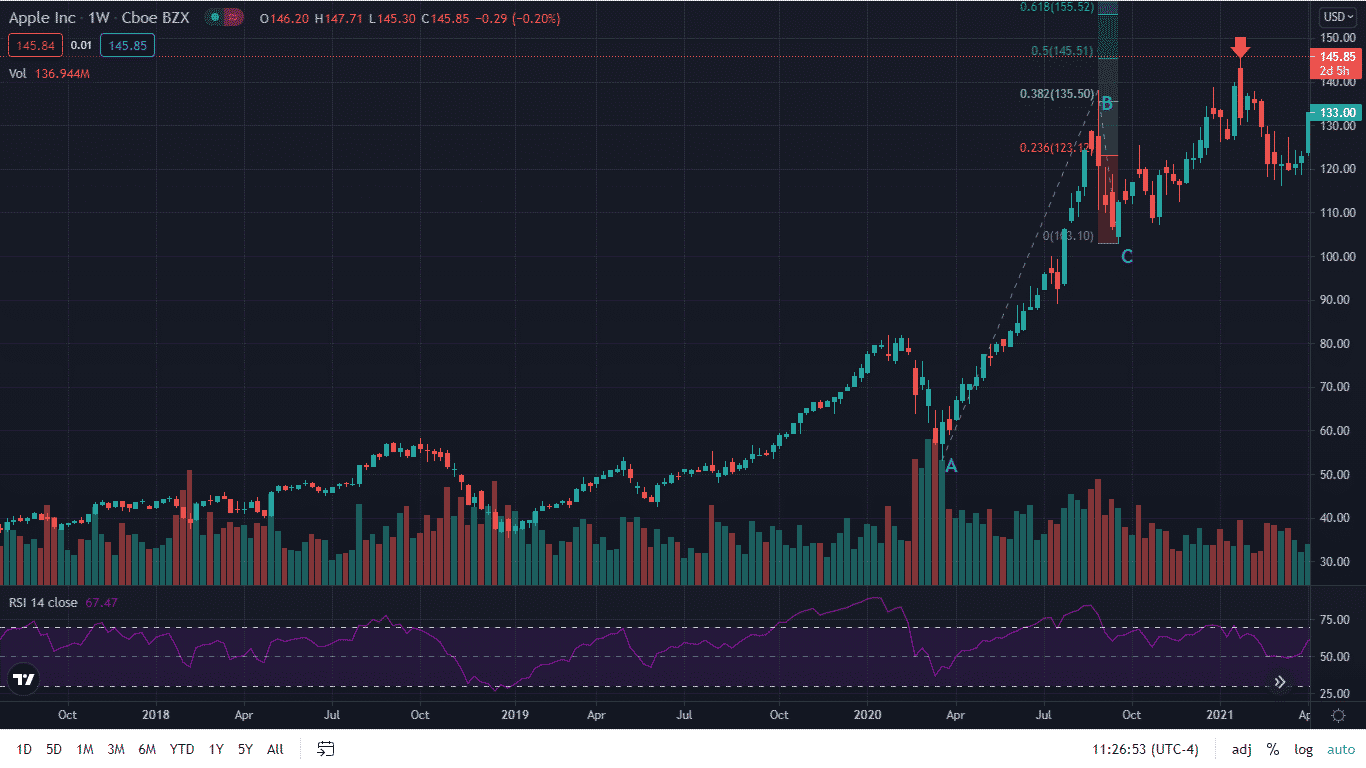
You can spot the Fibonacci levels 0.236, 0.382, and 0.5 plotted at $123.12, $135.50, and $145.51, respectively in the chart.
The Fibonacci Extension levels represent Fibonacci percentage 23.6%, 38.2%, and 50% of the primary trend ($137.98-$53.15) added to the third point C at $103.10.
How To Use Fibonacci Extension To Trade
The Fibonacci Extension helps the traders to set the target and book profit.
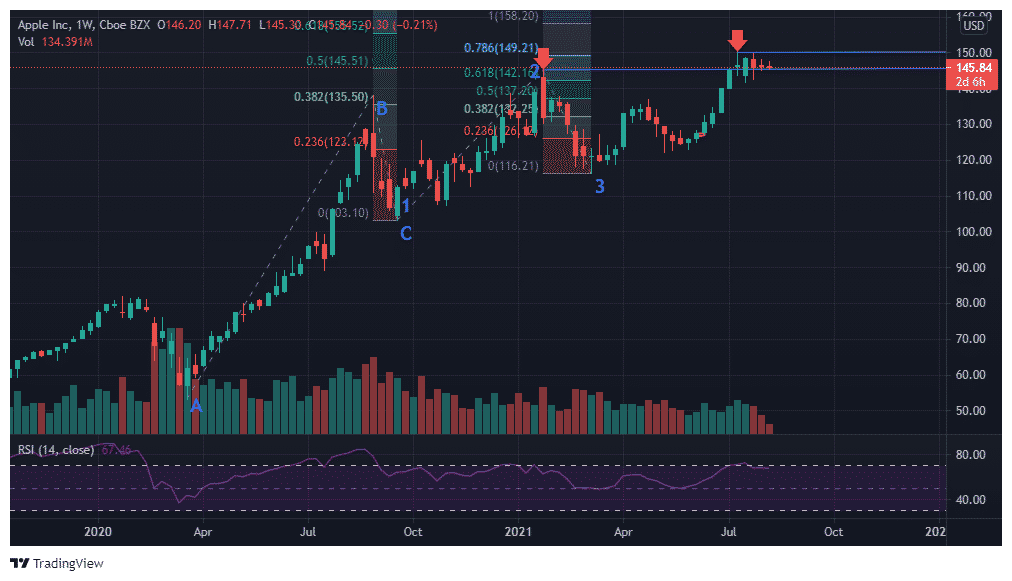
Let’s continue with the weekly Apple Inc. (AAPL) chart.
The primary trend AB retraces to around $103.10 and sustains above the $100 mark.
Thus, one can enter into a long trade in the stock.
The first initial target would be the previous high and above.
At ABC’s 50% Fibonacci Extension ($145.51), the price faced resistance and retraced to $116.33.
Further, the stock again resumed its uptrend after taking support to test the 78.6% Fibonacci Extension ($149.21) of sub-trend 123.
The use of Fibonacci Extension in a downtrend also assists in setting the target.
A Trading Example
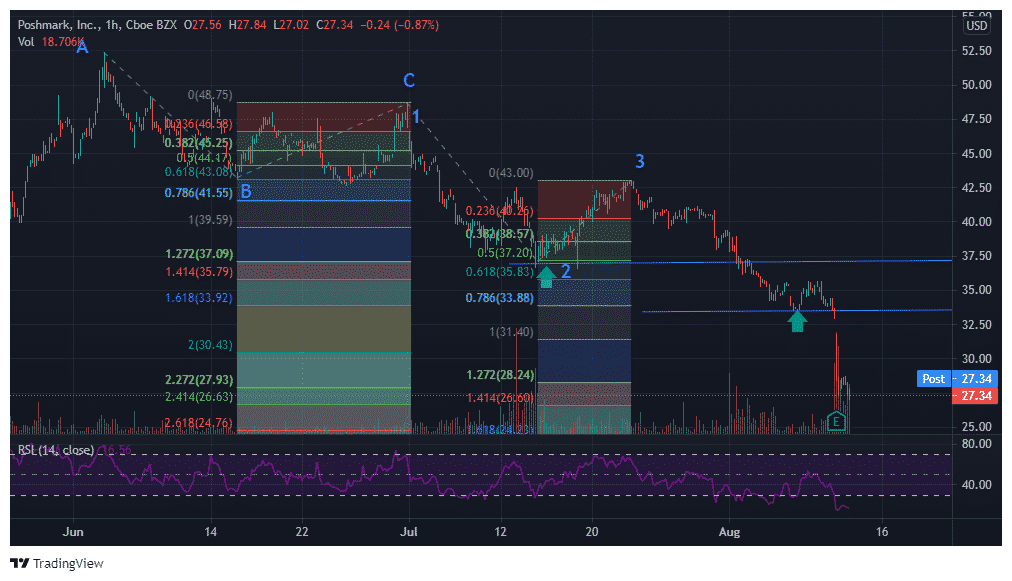
The below is an hourly chart of Poshmark, Inc. (POSH).
The price faced resistance above $50 and failed to sustain above it.
It resulted in a sharp sell-off from $52.39 to $43.11.
The price retraced to point C to $48.75 before falling again.
It fell to around $37.09 to find its support, coinciding with the 1.272 Fibonacci Extension of ABC.
It retraced back further to point three at $43 before continuing its fall.
The price fell further deep to $33.5, coinciding with 1.618 Fibonacci Extension of ABC and 0.786 of sub-trend 123.
You can apply the Fibonacci Extension trading tool in any timeframe, from hourly to daily and weekly.
The application of it provides the possible trading targets.
It depends on the trader’s judgment to assess whether the price will go beyond the extension level to continue the trend or reverse.
The extension level 61.8 works best for slow trends, whereas the price touches the 100 level mark in solid market trends.
The extension level 1.618 and 2 also seem to be possible in a much stronger momentum trend.
Each extension level acts as a support or resistance.
Thus, the price moving aggressively through an extension level indicates its advancement towards the next Fibonacci level.
Bottom line
You can use the Fibonacci Extension tool in any timeframe to set your trading targets.
It is a trend momentum tool that sets out the levels where the price can reach.
It is a trading guide, but price may not always stop at such a Fibonacci level.
Hence, it would be beneficial to use it in confluence with other trading tools such as support/resistance, moving average, RSI, etc., to avoid relying on it exclusively.
Trade safe!
Disclaimer: The information above is for educational purposes only and should not be treated as investment advice. The strategy presented would not be suitable for investors who are not familiar with exchange traded options. Any readers interested in this strategy should do their own research and seek advice from a licensed financial adviser.


