


A stock with good relative strength simply means that it is performing better than the general market.
A stock with poor relative strength means it is under-performing relative to the market.
By market, we mean the board stock market in general.
The S&P 500 is often used as the benchmark because it consists of 500 large companies representing roughly 80% of the total market value of the U.S. stock market.
Contents
“Relative Strength” is not to be confused with the RSI, which is the “Relative Strength Indicator” that most charting platforms will have to indicate momentum or overbought/oversold price action conditions.
Relative strength is different and is not often found in the indicators panel of your charting platform.
If it is, it might sometimes be labeled as a “Relative Strength Comparator” (RSC) to avoid confusion about RSI.
Example Of Strong Relative Strength
Gilead Science (GILD) is an example of a stock with strong relative strength:
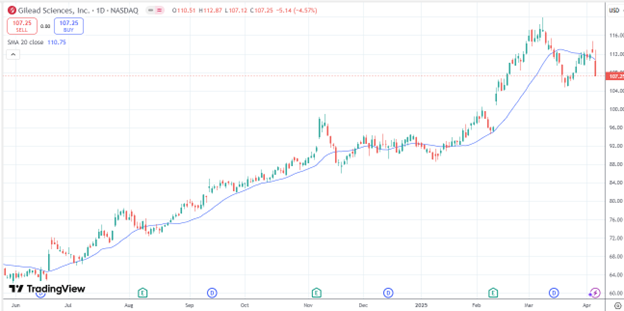
Yes, the chart is going up. But that is not the criteria for relative strength.
The chart needs to be going up better than the general market.
If we were to plot GILD and SPY (the S&P 500 ETF) during the same look-back period of the last twelve months:
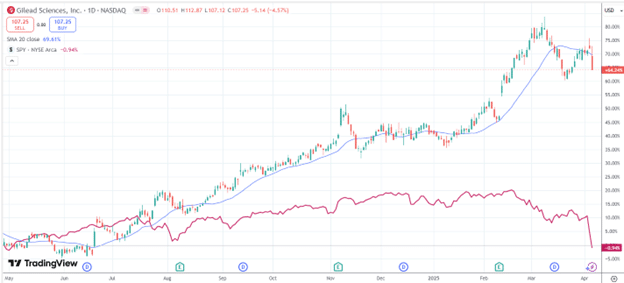
We see that GILD is up 60% while the S&P 500 is flat.
As of April 2025, the S&P 500 is about where it was 12 months ago.
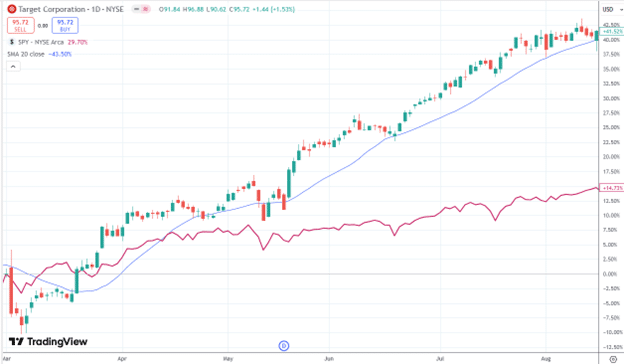
Example Of Weak Relative Strength
Target (TGT) has weak relative strength at the current time…
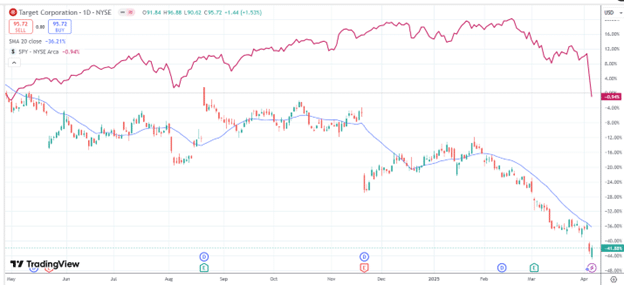
TGT is down 40% in the last twelve months, while the red SPY line is above it.
Time Frame And Look-Back Period
When we speak of relative strength, we must indicate the time frame.
While Target is weak at the current time, it had strong relative strength in the past.
If you just scroll the charts back to March 2021:
The relative strength will be different depending on the look-back period.
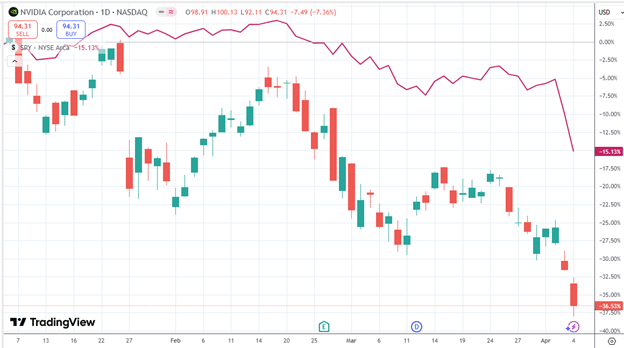
A shorter-term trader may look at relative strength over the past three months and see that NVIDIA (NVDA) has poor relative strength…
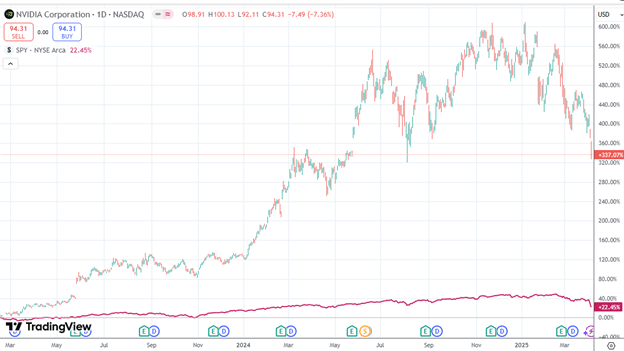
However, a longer-term investor may see its relative strength has been strong over the last two years.
In the case of DoorDash (DASH):
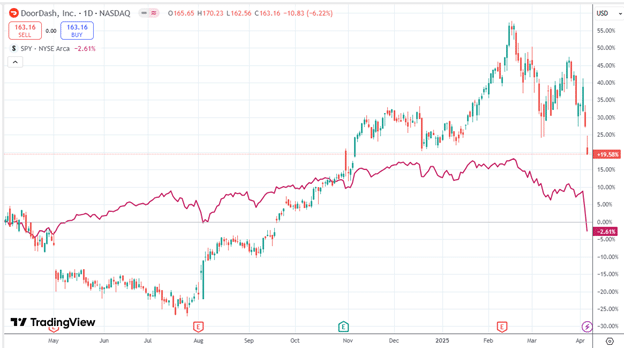
It was under-performing the market from April to November.
Then it out-performed the market in November.
Charting Multiple Charts
Drawing one chart overlaid on top of another is useful for seeing this.
In TradingView, click on the compare symbol icon next to the ticker, and you can add one or more additional graphs to the chart:
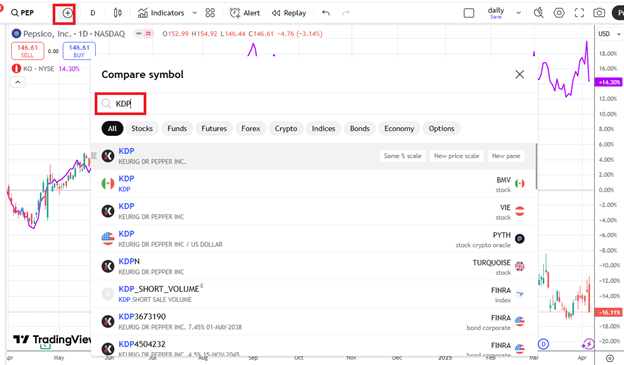
Below, we see that Pepsico (PEP) is underperforming both Coca-Cola (KO) and Dr. Pepper (KDP):
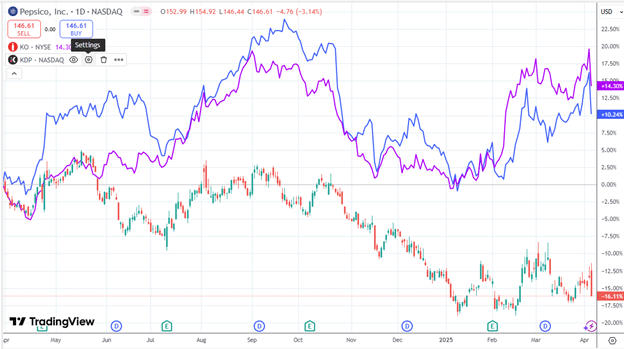
You can change the color of the lines with the Settings icon next to the ticker.
Price Ratios
Plot price ratios are another way to see the trend in relative strength.
To chart the price ratio of GILD over SPY, we can simply type “GILD/SPY” as the symbol in TradingView:
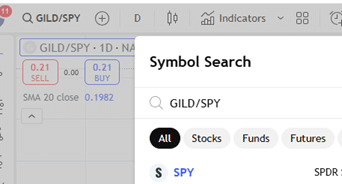
The software will take the price of GILD, and divide that by the price of SPY, and chart the results:
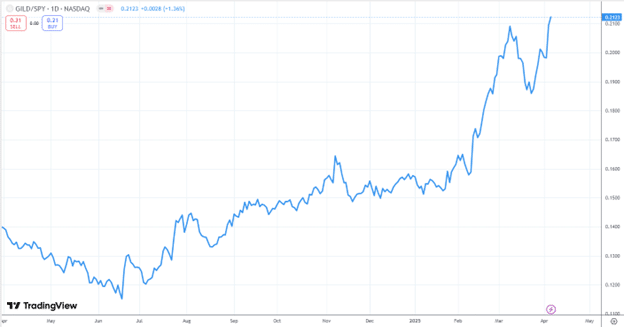
We switched the graph to a line graph because these are not candlesticks of price action.
The graph plots the numeric value of one price divided by another.
The actual numerical values on the vertical axis are not relevant.
We want to see if the chart is sloping up or sloping down.
For the most part, GILD is sloping up, indicating improvement or increase in relative strength.
The price of GILD is getting bigger in relation to the price of SPY.
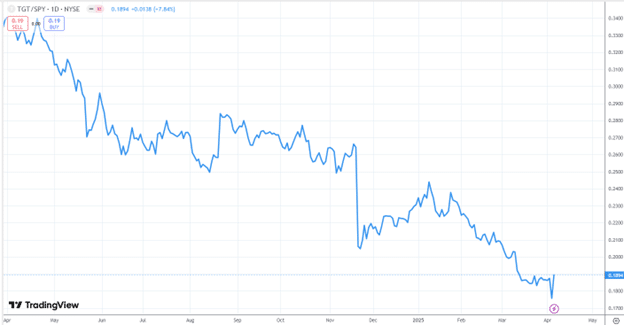
Doing the same with TGT versus SPY confirms that TGT has poor relative strength due to the downward-sloping graph of their price ratios.
Shown below, DASH (DoorDash) divided by SPY had declining relative strength from April to August:
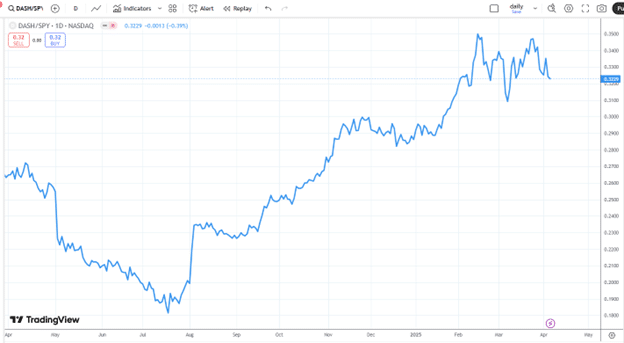
Then, after the August earnings announcement, the stock took off with increasing relative strength.
StockCharts
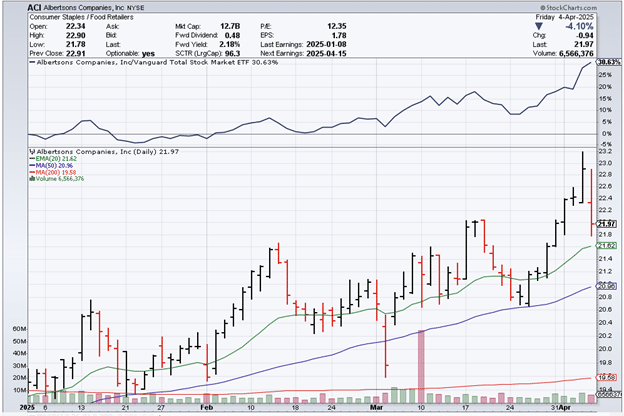
StockCharts can be configured to show a similar relative strength line in the top panel:
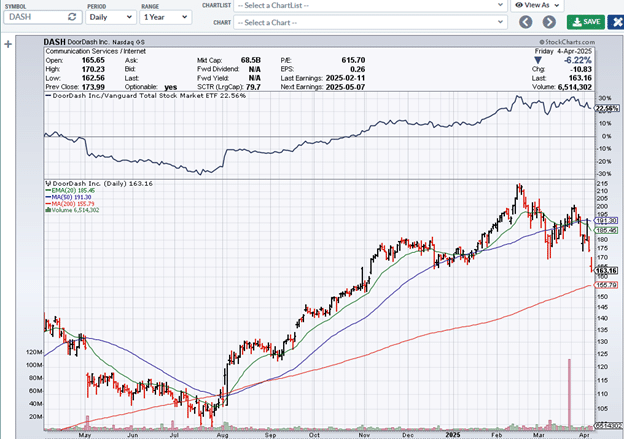
Source: StockCharts
By default, it uses Vanguard Total Stock Market ETF instead of SPY as the benchmark comparator.
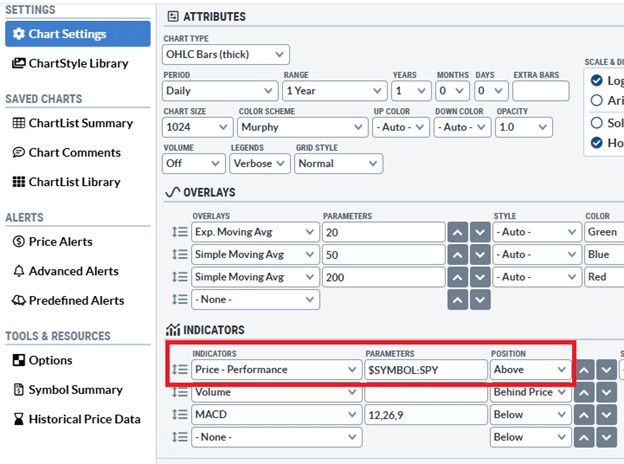
One can easily change it to SPY in the Parameters of the “Price Performance” indicator under Chart Settings…
Finding Stocks With Strong Relative Strength
Now, the question is how to find stocks with strong relative strength.
IBD has a relative strength rating that ranges from 1, which is the worst, to 99, which is the best. High-performing stocks should have a rating of 80 or better.
The IBD 50 list is another good place to look since it is their selected top 50 stocks based on strong relative strength and a combination of other metrics.
However, this information requires an IBD paid subscription.
To figure out which stocks are on the IBD 50 list, you can look at the constituents of Innovator IBD 50 ETF (FFTY) on barchart.com
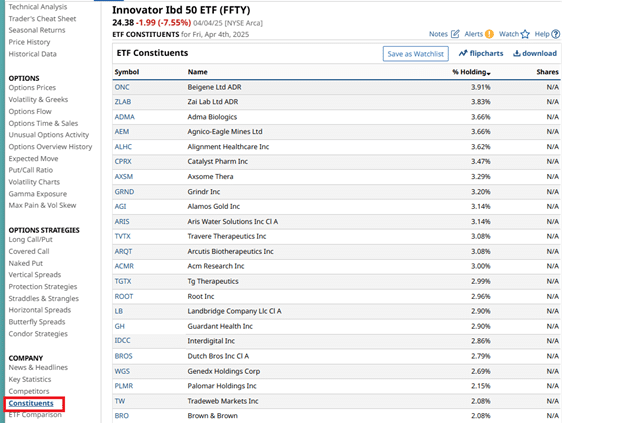
Source: barchart.com
As a whole, the group of 50 might average out to perform similarly to the board market:
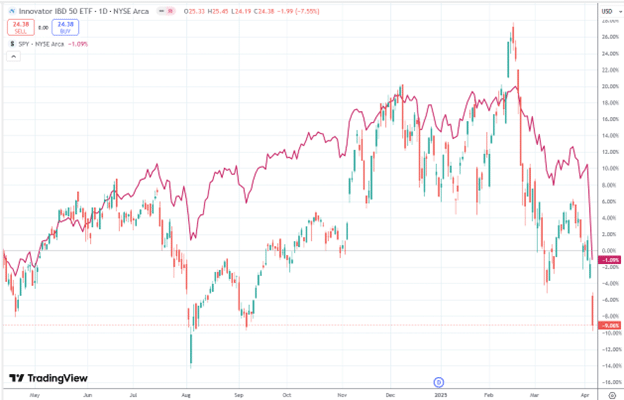
Investors can perform the relative strength exercise on each of the fifty stocks to pick out the best among them.
Scans for Relative Strength
There are not that many stock screeners that filter by relative strength.
Even the enormous FinViz scanner doesn’t have it.
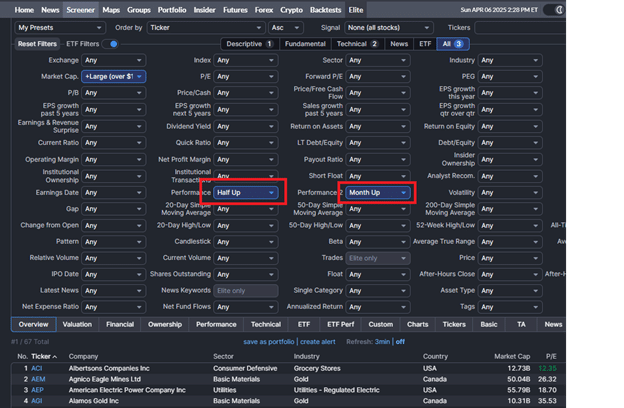
Source: FinViz.com
However, you can get a filtered list that is somewhat close by scanning for those stocks that are up in price in the past 6 months and also up the last month.
Then, you just have to go through each of those stocks manually.
If that list is too large, you can narrow it down by filtering only those with a large market cap, etc.
In this case, the first one on the list is a great find.
Albertson (ACI), the grocery store, is still in an uptrend with positively stacked upward-sloping moving averages while the rest of the market is dropping.
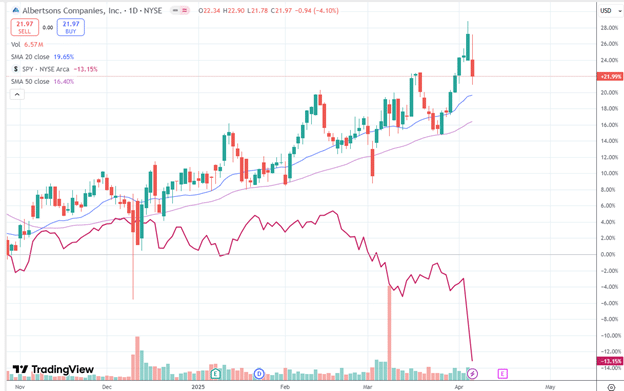
A look at its price ratio against the VTI benchmark confirms that it has increasingly strong relative strength:
Conclusion
Looking for relative strength enables you to find strong stocks in a chaotic market.
This article introduced a few tools by which you can do this.
We hope you enjoyed this article about how to find stocks with good relative strength.
If you have any questions, send an email or leave a comment below.
Trade safe!
Disclaimer: The information above is for educational purposes only and should not be treated as investment advice. The strategy presented would not be suitable for investors who are not familiar with exchange traded options. Any readers interested in this strategy should do their own research and seek advice from a licensed financial adviser.


