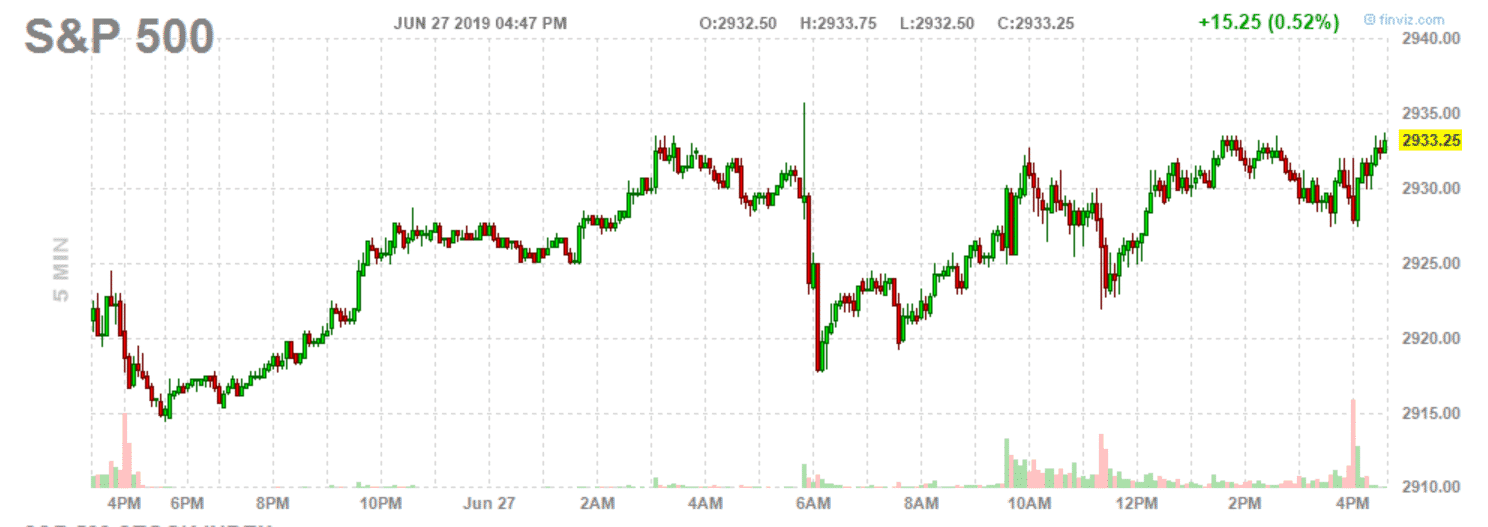

Financial visualisation website FINVIZ.com is one of my favourite trading tools, and best of all it’s free. I use it every day for looking at after-hours futures markets and it has some other cool features which I’ll share with you today.
Finviz is one tab I always have open in Google Chrome and I’ll check the after-hours futures occasionally. Usually there’s not too much happening, but if I do see a big move either way, then I might head over to some financial news sites (or Twitter) to see what happening.

SCREENER
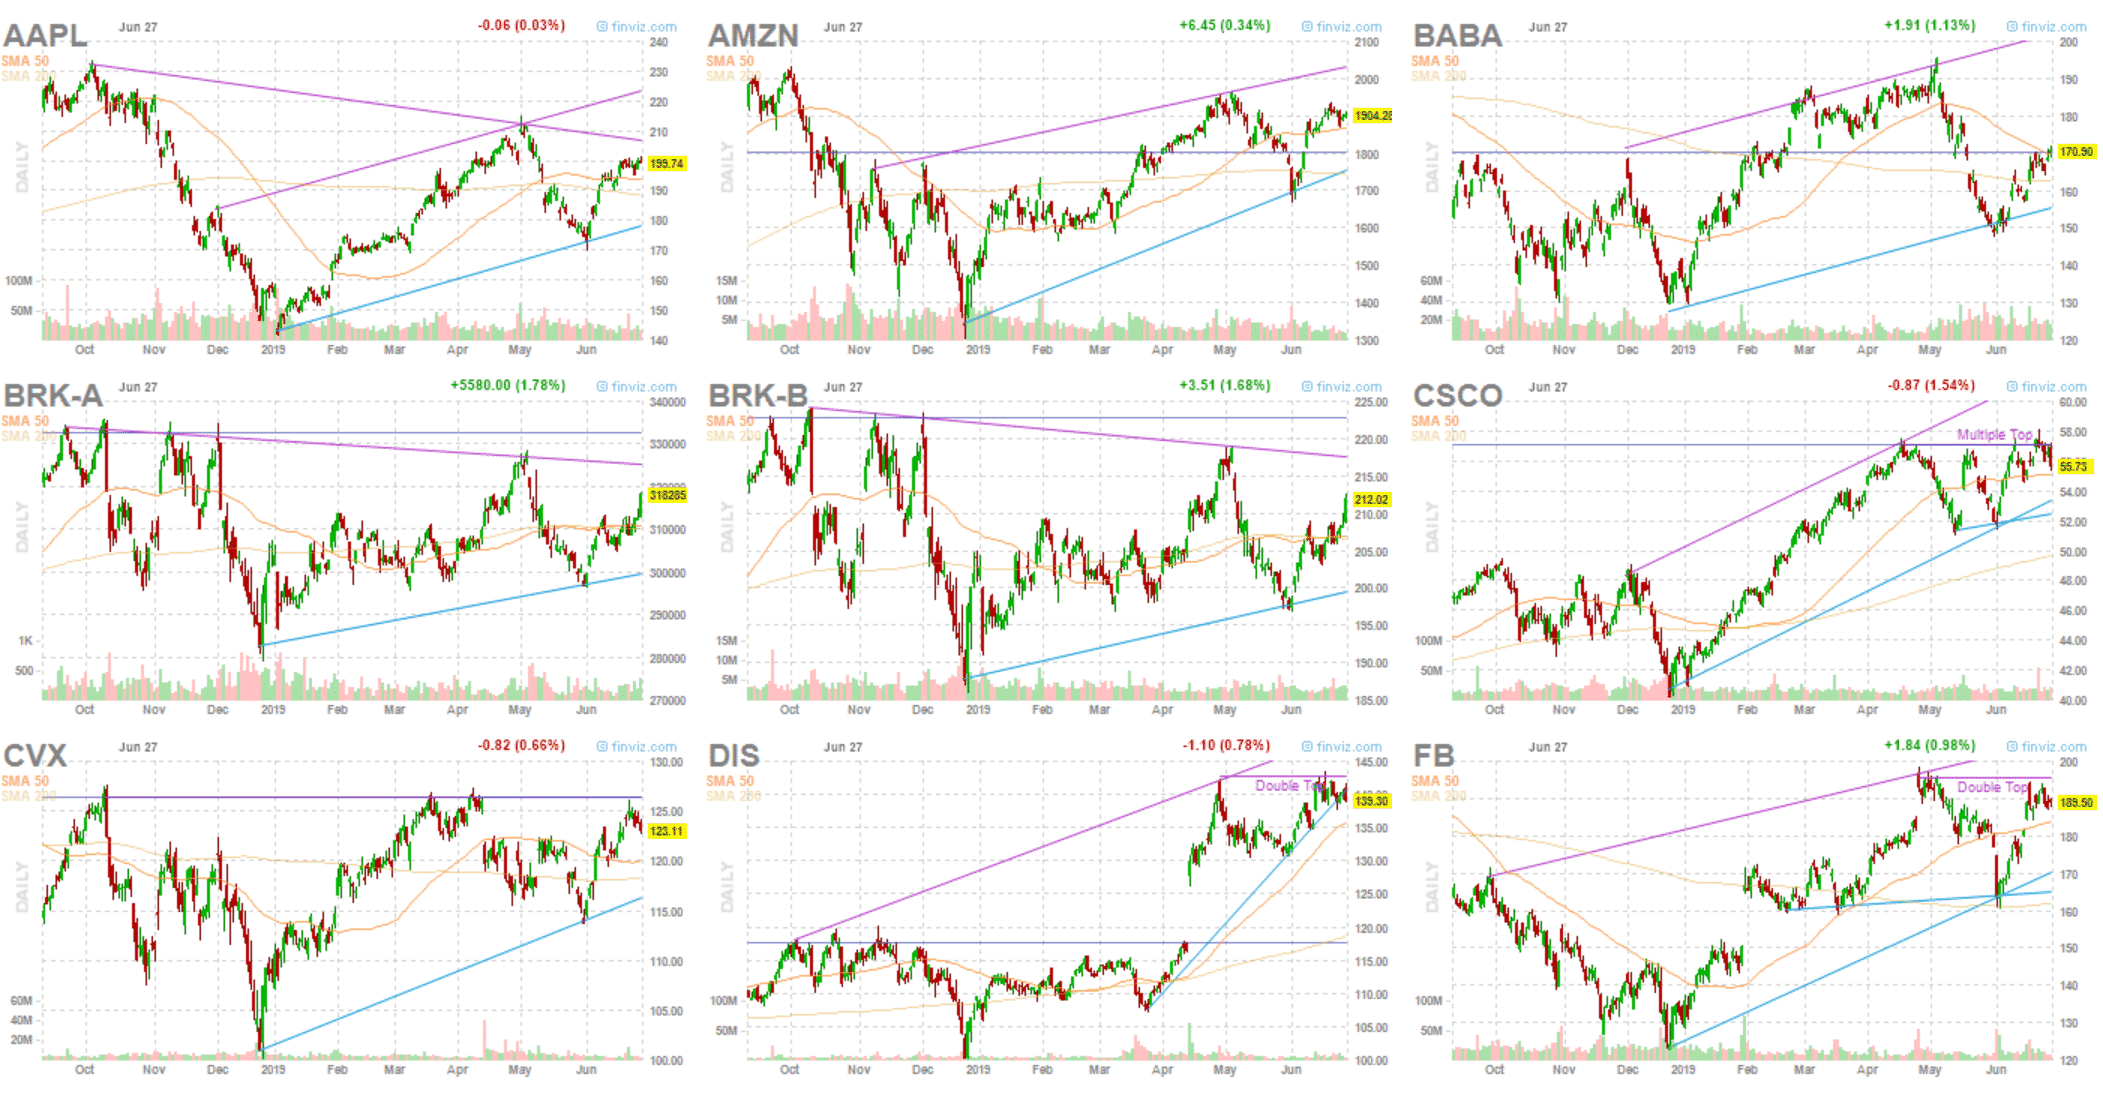
The screener is something that I use quite regularly also. Here is a nice simple screen that I use to show me Mega Cap stocks that are looking technically strong. This will give a few trade ideas from time to time.

Below the screener, Finviz gives a snapshot of the charts which allows for easy scrolling. From here you can left click to drill further into each chart.

GROUPS
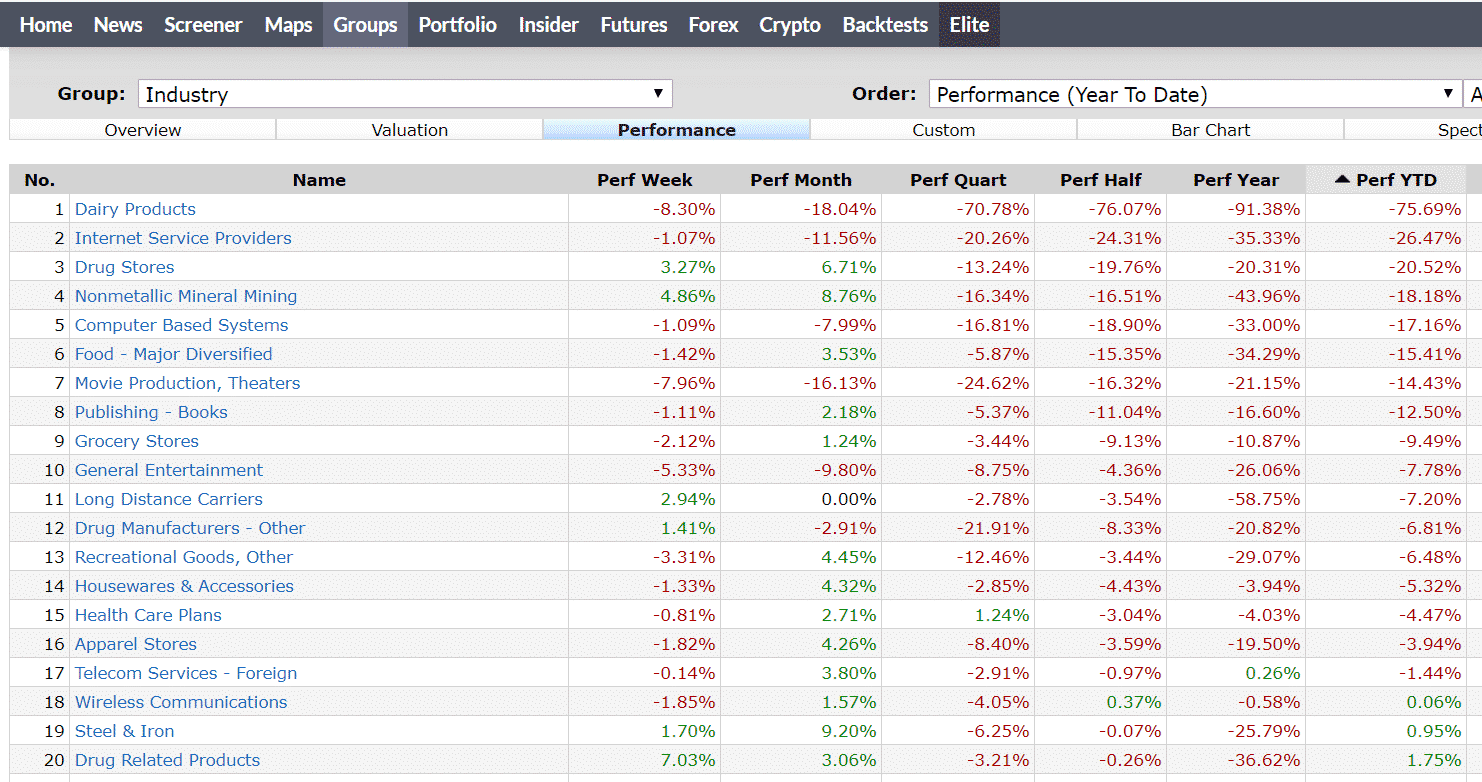
Groups is another function that I use regularly to find trade ideas. With this scan, I like to look at Industry Groups and see which ones have been underperforming. From there I drill down and see if there are any individual stocks that may be worth putting in to a watchlist with a view that they will bounce back at some point.
This is how I found renewable energy stocks which were a great performer in 2017.

PORTFOLIO
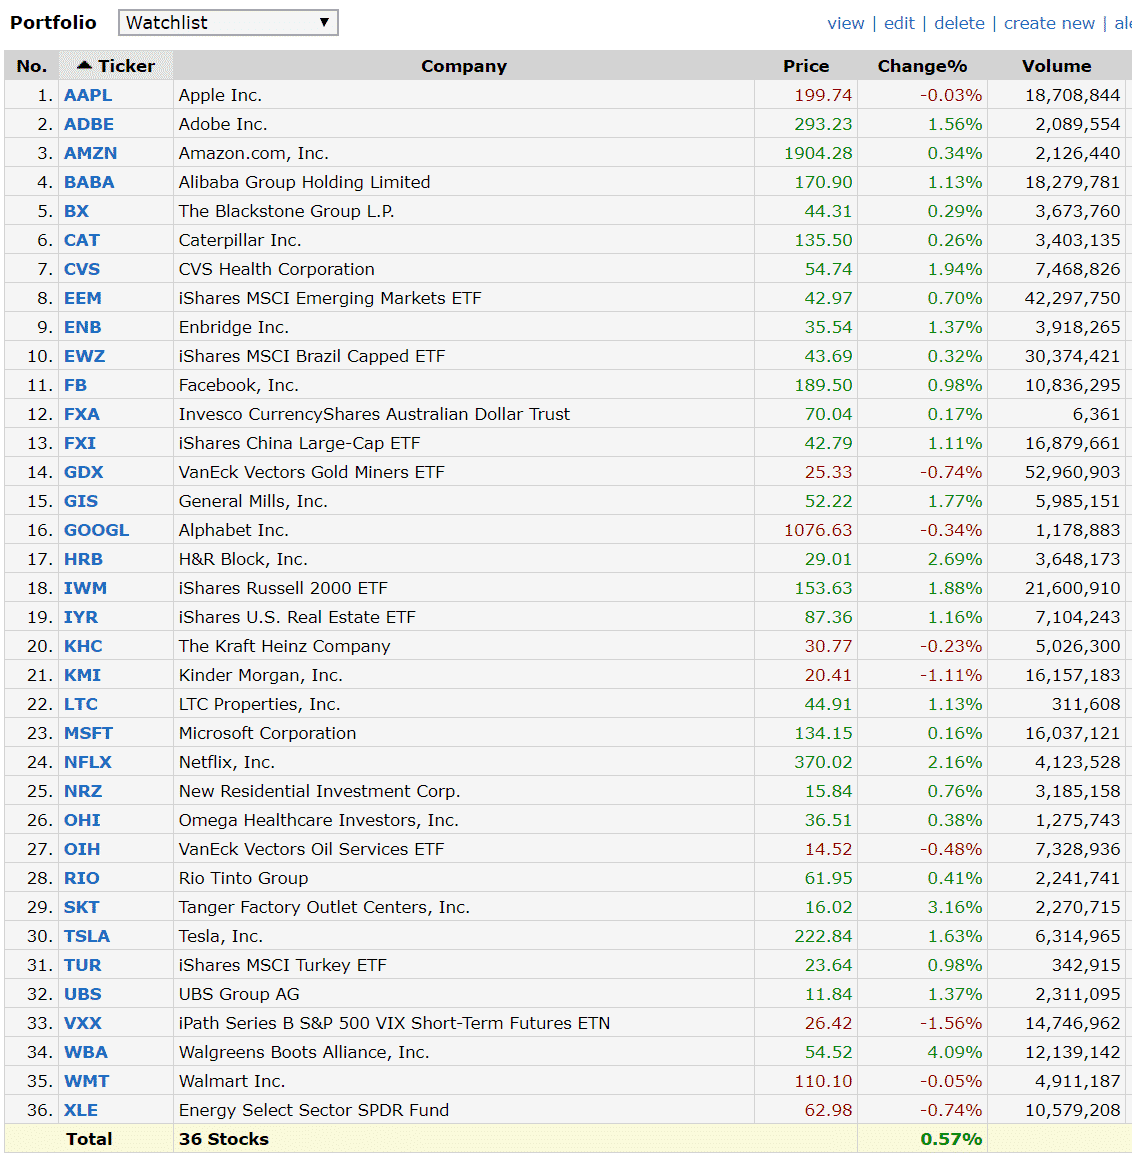
Within the site, and again all for free, you can create custom portfolios to quickly and easily see the performance details over a period of time.

Finviz is a very valuable tool in my opinion and it’s great that there are so many functions available to free users.
Try it out and let me know what you think.
Trade safe!
Disclaimer: The information above is for educational purposes only and should not be treated as investment advice. The strategy presented would not be suitable for investors who are not familiar with exchange traded options. Any readers interested in this strategy should do their own research and seek advice from a licensed financial adviser.


