


Contents
- Step 1: Initiate the Double Calendar
- Step 2: Set Take Profit Level
- After Earnings
- Shifts In The Expiration Line
- Step 3: Close The Calendar Nearest Price
- Step 4: Roll The Other Calendar In And Out
- Step 5: Wait Till Expiration
- How Were The Strike Prices Of The Calendars Set?
- How Were The Front And Back Month Expiration Picked?
- Backtest
- Make The Strategy Your Own
- What Is The Edge In This Strategy
- Conclusion
- The Data
The price of a stock can make huge jumps in either direction over earnings.
If you are going to trade across earnings, you need a structure that is very forgiving. The double calendar is one.
It is a defined risk non-direction options strategy with large breakeven points.
According to our backtest, the strategy results in a positive expectancy when traded according to certain rules.
It also takes advantage of the shift in implied volatility skew seen across expiration months.
This skew shift happens at earnings and provides the double calendar with a statistical edge.
Let’s take a look at an example.
Step 1: Initiate The Double Calendar
Walmart (WMT) reports earnings before market open on November 17, 2020.
The trade is initiated one hour before the market closes on November 16.
If the earnings report was expected to come out after market close, then the trade would have been placed on the day of the earnings — basically before the event but as close to the event as possible.
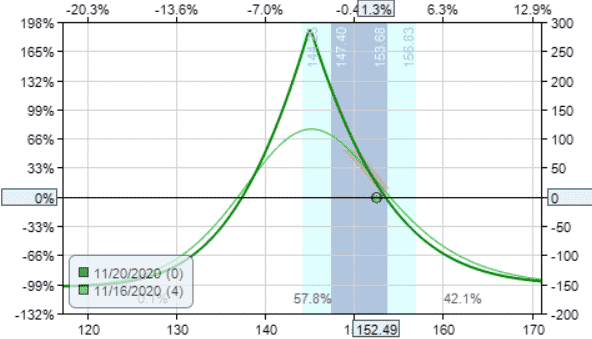
The investor buys one put calendar and one call calendar.
Date: November 16 Price: $152.49
Buy one WMT $145 put with expiry Dec 18 at $1.985
Sell one WMT $145 put with expiry Nov 20 at $0.47
Buy one WMT $160 call with expiry Dec 18 at $1.88
Sell one WMT $160 call with expiry Nov 20 at $0.78
Total Debit: $261.50
Step 2: Set Take Profit Level
The investor would like to take profit at 15% of the debit paid. In this case, it would be a profit of $39.23.
Our educational example is using one contract for ease of calculation. In real investing, an investor would increase the number of contracts since a $39 profit is not large enough.
The payoff diagram looks like the following with the blue line being the expiration graph at the time of the front-month expiration.
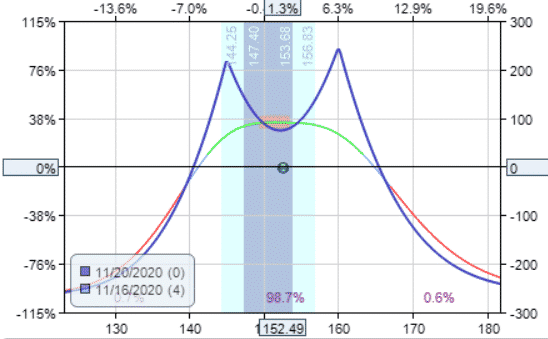
Be careful of the sag in between the two calendars. This is about the most sag you want to see. If it sags more than this, try adjusting the strikes closer to the money or moving both the front and back month expiry out. Otherwise, skip the trade.
Immediately after the order is filled, the investor places a limit order to sell both calendars at a price of $300.73 (which is calculated by 1.15 x $261.50).
This will give the investor a 15% return on the initial debit paid.
After Earnings
At the market open the next day when earnings are known, a lot of things are happening.
Price can gap up/down significantly and make large swings. Since we are close to the front-month expiry, gamma (rate of change of delta) is large. The bid/ask spread can be wide. The IV of both the front month and the back month options will drop suddenly and at different rates.
The profit/loss can swing from positive to negative in a matter of minutes.
If any of these random factors affect options prices in the four legs in such a way as to give us a 15% profit, the software will automatically close the trade and lock in that profit.
Sometimes we get lucky. More often, we don’t. But don’t worry, there are more ways to win in strategy.
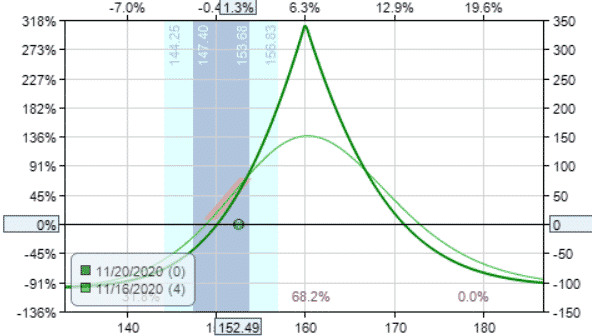
As in the WMT case, the P&L graph looks like this one hour after the market open.
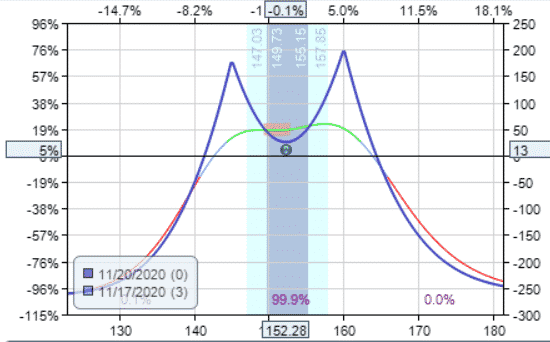
This is quite unusual in that price did not move much.
In any case, the investor takes no action if the profit target is not hit. There is no need to have stop loss because this is a defined risk strategy. Having a written trade plan is what will keep the investor from being scared out of a trade for a loss only to see it return to profit later.
Shifts In The Expiration Line
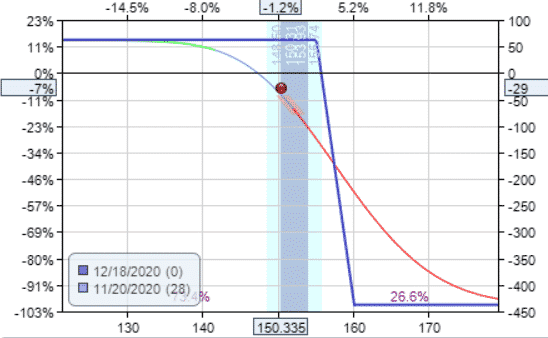
Note that the expiration graph had dropped due to the volatility drop of all four option legs.
The sag in the graph was around the $90 level before the earnings. Now the sag has dropped down to around $30. Ideally, we don’t want this point to be below the zero profit horizontal level.
Unlike the expiration lines of vertical spreads, iron condors, and butterflies, the expiration lines of calendars and diagonals can shift and continues to shift with time.
They are not fixed and are only estimates. The P&L graph at the front month expiration depends on the price of the back month option which depends on the volatility at the time of front-month expiration.
Like you and I, the software model can not predict future volatility. Hence, it is only an estimate.
Another noteworthy point is that whenever you see curves in the expiration graph, it is because there are different expiry dates involved.
Straight lines are seen when all options expire on the same date which is not the case with calendar spreads.
Step 3: Close The Calendar Nearest Price
The next action point for the investor is the day of the front-month expiration.
At one hour before the front-month November 20 expiration, the profit target was still not hit. The investor cancels the limit order.
The payoff graph shows the price is closer to the put calendar.
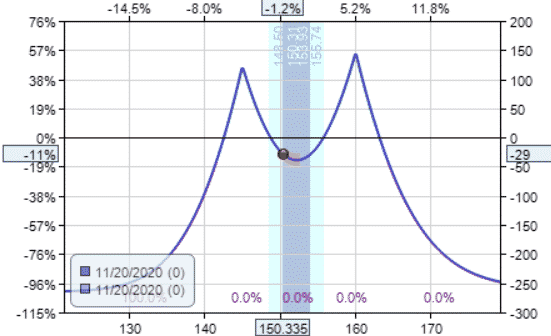
So the investor closes the put calendar to reduce the risk of being assigned.
Sell to close one Dec 18th WMT $145 put
Buy to close one Nov 20th WMT $145 put
Credit: $163
Keep in mind that it is still possible to be early assigned some days before expiration, so reserve enough cash to purchase the shares of stock.
Step 4: Roll The Other Calendar In And Out
In addition, the investor rolls the short call one strike closer into the money and with expiration extended out till the back month’s expiration.
Sell to open one Dec 18th WMT $155 call
Buy to close one Nov 20th WMT $160 call
Credit: $161
In effect, the call calendar has been rolled into a bear call spread.
Step 5: Wait Till Expiration
These two adjustments bought in a combined credit of $324, which is greater than our initial debit of $261.50 by $62.50.
This means that if the bear call spread remains out of the money by expiration, the investor would be profitable by $62.50.
This was in fact the case for WMT, picking up a return of 24%.

We Have Added Risk To The Trade
We need to keep in mind that when we rolled the call calendar into a bear call spread, we have actually increased the risk in the trade.
Before the adjustment, the max risk on the call calendar is the initial cost of the call calendar, which is $110. After the adjustment, we see from the new payoff graph that the max risk has increased to about $440 (or about 4 times).
If this exceeds the allowable risk per trade for the investor, then the investor would not perform the roll and would close the call calendar instead.
While in this case, it turned out fine in that the bear call spread was never tested.
Let’s see hypothetically what happens if price happens to reverse and goes up through our bear call spread:
Initial cost of the double calendar: –$261.50 Close the put calendar: $163 Roll the call calendar into bear spread: $161 Settlement at expiration with max loss of the bear call spread: –$500
Net P&L: –$437.50
That would be a loss of 167% of the initial capital invested — 437.50/261.50 = 1.67
How Were The Strike Prices Of The Calendars Set?
Determine the expected price move to the front expiry by looking at the cost of the at-the-money straddle for that expiry date.
Set the call strikes and the put strikes to be closest to the upper and lower expected moves respectively. If you have to make a judgment call, favor moving the strikes closer to the money.
How Were The Front And Back Month Expiration Picked?
For the front-month expiry, choose the closest expiry that has at least 2 days before expiration. If the trade is being placed on Wednesday, you can choose the Friday expiry. If the trade is being placed on Thursday, then choose the expiry one more week out.
For the back month expiry, choose the closest monthly expiry (not weekly) that has at least 21 days away from the front-month expiry.
Backtest
Using OptionNet Explorer, we backtested the strategy on the 30 Dow stocks. What is great about OptionNet Explorer is that it has historic option prices at the intraday level (down to 5-minute intervals).
Because this was a manual test, there may have been opportunities to take profit that was not taken due to the fact that we did not look at every single 5-minute interval.
Nevertheless, the results were:
26 of the trades were profitable with a total of $1974.79.
4 of the trades were losers with a total loss of –$296.50.
The average amount won per trade is $75.95 The average amount lost per trade is $74.13
With a win rate of 87% and the average amount won about the same as the average amount lost, the backtest shows a positive expectancy strategy.
Make The Strategy Your Own
There is nothing special about initiating the trade one hour before earnings.
You can initiate the trade any time during that day or even the day before.
The closer you can wait to initiate the trade means that the price can not move too far away from your setup prior to earnings.
You don’t have to hold spread till expiration, you can change the plan to close the spread anytime it gives a profit. Or a timed exit of two days prior to expiration, etc.
You can also try out different profit targets other than 15%.
In general, if you find that you are winning nearly all the time, then it is reasonable to increase the profit percentage.
The optimal number probably will depend on the market regime at the time and can change from year to year.
Similarly, you can also try different expirations cycles.
When rolling the short leg in and out, you can adjust the width between the strikes to optimize for market conditions.
We consistently rolled it one strike in only to be consistent when doing the backtest.
What Is The Edge In This Strategy
When the earnings announcement comes out, there is a revelation of information that reduces uncertainty.
This results in a drop in implied volatility of options across the board.
The edge comes from the fact that the IV drop of the front-month expiry is much more than the IV drop of the back month expiry.
Here are the IV levels of WMT:
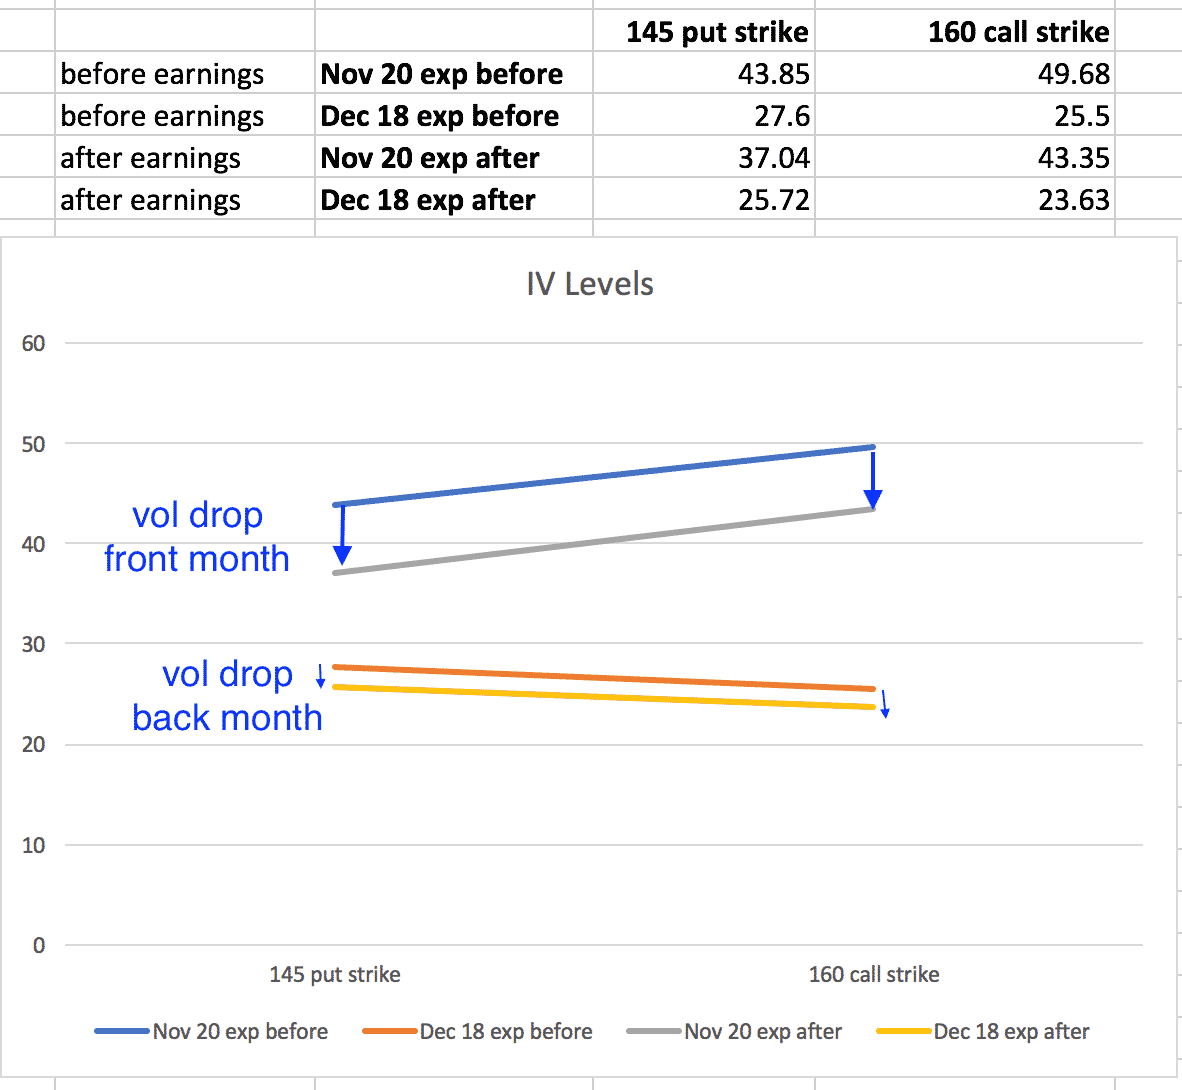
The pre-earnings IV value of the November 20 $145 put is 43.85.
After earnings, the IV of that option dropped to 37.04. That’s a drop of 15.53%.
This is a big drop as compared to the Dec 18 $145 put, which went from an IV value of 27.6 to only 25.72. That’s a drop of only 6.81%.
Since we are selling the November 20th options, a big drop in those options is an advantage for us.
This is the statistical advantage that we are exploiting.
The same can be said of the $160 call strikes in the call side calendar.
By having two calendars, we are doubling our statistical advantage.
Dual calendars are necessary in order to have a wide area of profitability for the price to fall on.
We set the peaks of the calendars to the theoretical expected move of price.
This theoretical value is determined by option pricing in the marketplace.
The cost of an at-the-money-straddle is a good estimation of what the market thinks the price of the stock will move to if the stock makes a one standard deviation move.
If the stock does move to the expected move, we should get peak profits in one of the calendars.
Each calendar by itself has a high reward to risk ratio.
WMT’s put side calendar has a reward to risk of 2 to 1:
WMT’s call side calendar has a reward to risk of 3.5 to 1:
When stock price jumps to the expected move, we have one winning calendar and one losing calendar.
Since the winning calendar wins twice a many dollars as the losing calendar, we get a positive expectancy.
Conclusion
The advantages of the double calendar earnings trade are that it is a defined risk and non-directional.
The max you can lose on the strategy is the initial debit you paid.
There is no need to look at past earnings and predict upcoming earnings nor the direction of the price move.
While there is individual discretion as to strike selection and post-earnings adjustments, our backtest shows that the double calendar wins much more than it loses with very promising results.
However, as is often the case with strategies that have high win rates, those few losers can sometimes incur large losses.
While the initial double calendar has a max loss of the initial debit paid. However, if you make adjustments such as rolling a calendar into a bear call spread, then this changes the trade and increases the max loss to a much greater amount.
Of course, as always, past results are not necessarily indicative of future results.
The Data
Trade safe!
Disclaimer: The information above is for educational purposes only and should not be treated as investment advice. The strategy presented would not be suitable for investors who are not familiar with exchange traded options. Any readers interested in this strategy should do their own research and seek advice from a licensed financial adviser.


Dear Gav,
one question on the latest strategy with the double calendar: When in the end the wmt bear call spread get to it´s max. loss it is a about 440 $ loss and together with the credit of 62.50 there is a outcome of about 377.50 loss –> 144 % in relation to die initial debit of 261.50.
In the backtest there is only one loser with – 15 %. So shouldn´t that possibility of big loss events be mentioned?
Or do I have a mistake in my calculation and interpretation?
Thank you for your help and great input in the option field!
Alfred
Hi Alfred, yes I have updated the article with some more detail – refer to Step 5
Hey gavin thank for the great content.
I have a question .
The calnder is a stretegy that has a negative vega.
After the earning there most of the time iv crush that is hurt the calnder.
1.its not better to do wide iron condor? That profit from the iv crush?
2.you think that some of the criteria of the double calnder earning trade need to be low iv rank? Like 0-15 so the iv crush will be smaller ?
Hi – just come across this article. I really love the concept. I don’t know why calendar trades are not more talked about in the trading blogoshere.
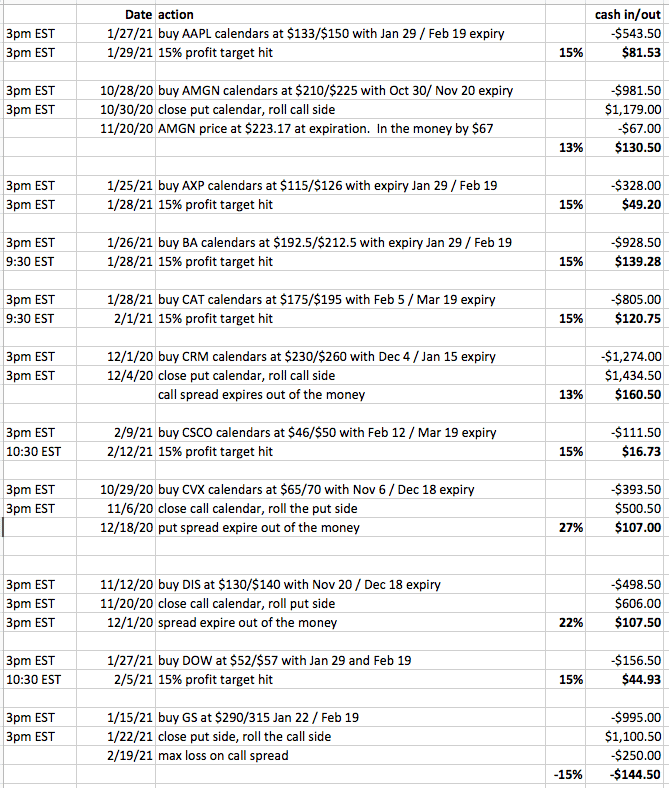
I wanted to ask, can you provide the full data that you used? The article mentions 26 winning trades and 4 losers but the data only shows 11 trades.
Also, do you have any further/more recent backtests?
Thanks, Moor
Hi Gavin,
What an interesting read! Thanks very much for all the time you’ve put in to writing this article.
One question I’ve got for you: I’m struggling to work out how to decide on the various strike prices. You talk about an “at the money strangle” to determine the expected move, but I can’t get my head around how this works in practice.
Could you please expand on this point?
Thanks so much!
DT
Thanks for the kind words DT. Here is an article and video on the subject that should clear things up for you. If you have further questions, please just reach out.
https://optionstradingiq.com/how-to-calculate-the-expected-move-of-a-stock/
Thanks a million, Gavin.