


Today we’ll look at various types of gaps that can occur in the stock market including common gaps, breakaway gaps, runaway gaps and exhaustion gaps.
Contents
- Introduction
- What is a Gap Chart Pattern?
- Common Gaps
- Breakaway Gaps
- Runaway Gaps (Continuation Gaps)
- Exhaustion Gaps
Introduction
Technical analysis can be quite intimidating if you’ve never used it before.
So, what is it and how do you start using it?
Technical analysis involves using price action and chart patterns to analyze and attempt to predict future price movement.
The other type of analysis is called fundamental analysis and uses financial statements and examination of the company itself to predict future price movement.
Which is better?
Neither are foolproof and it really depends on how you want to approach trading.
As for technical analysis, you are probably are already doing technical analysis.
Ever look at support or resistance levels?
How about indicators like MACD, RSI, CCI, or moving averages?
Ever notice a chart pattern like head-and-shoulders or triple tops?
These are all examples of technical analysis.
Today, we are going to focus on a group of chart patterns called Gap chart patterns.
We are not going to put a strategy together using technical indicators and the chart patterns.
But, if you want to trade using this chart pattern, you most definitely should include an indicator or two.
What is a Gap Chart Pattern?
Gapping occurs when a stock, or other trading instrument, opens above or below the previous day’s close.
Partial gapping occurs when the opening price is higher or lower than the previous day’s close but is within the previous day’s price range.
Full gapping occurs when the opening price is completely outside of the previous day’s range.
Gapping, especially a full gap, indicates a strong shift in the market’s expectations.
Common Gaps
Normally, there isn’t a major event that precedes this type of gap.
Common gaps usually get filled relatively quickly, typically within a day or two, compared to other gap types.
Common gaps are also known as “area gaps” or “trading gaps” and are usually accompanied by normal trading volume and many times they show up as partial gaps.
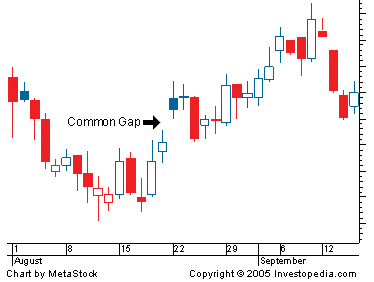
Image Credit: Investopedia
The presence of common gaps doesn’t really give us any indication of where things are headed because common gaps are relatively small, regular events in the price action of a security.
Technical analysts usually call common gaps filled gaps.
A filled gap refers to when the price from a gap retraces back to where the gap occurred.
For example, if a stock closed at $40.00 on Friday, and then opened on Monday at $41.50, the intra-day price on Monday will usually include the $40.00 price level.
Breakaway Gaps
A breakaway gap exhibits decisive price movement out of a range or other chart pattern.
A breakaway gap happens when the price gaps above a support or resistance level, like those we see when a stock is in a trading range.
When the price breaks out of a well-established trading range via a gap, that is a breakaway gap.
A breakaway gap could also break out of other chart patterns, such as a triangle, wedge, double or triple tops or bottoms.
Breakaway gaps are useful for confirming a new trend.
For example, the prior trend may have been up, the price continuing to bang against the resistance level, and then it has a breakaway gap to the upside above resistance.
This would tend to confirm that the stock has a renewed strong uptrend going on.
The breakaway gap tends to reveal strong conviction on the part of the bulls and in this case confirms a possible breakout.
Keep An Eye on Volume
A breakaway gap with high volume in comparison to average trading volume, indicates strong conviction in the gap direction.
A volume increase on a breakaway gap helps confirm that the price is likely to continue in the breakout direction.
If the volume is low on a breakaway gap there is a greater chance of failure.
A failed breakout occurs when the price gaps above resistance or below support but can’t sustain the price and moves back into the prior trading range.
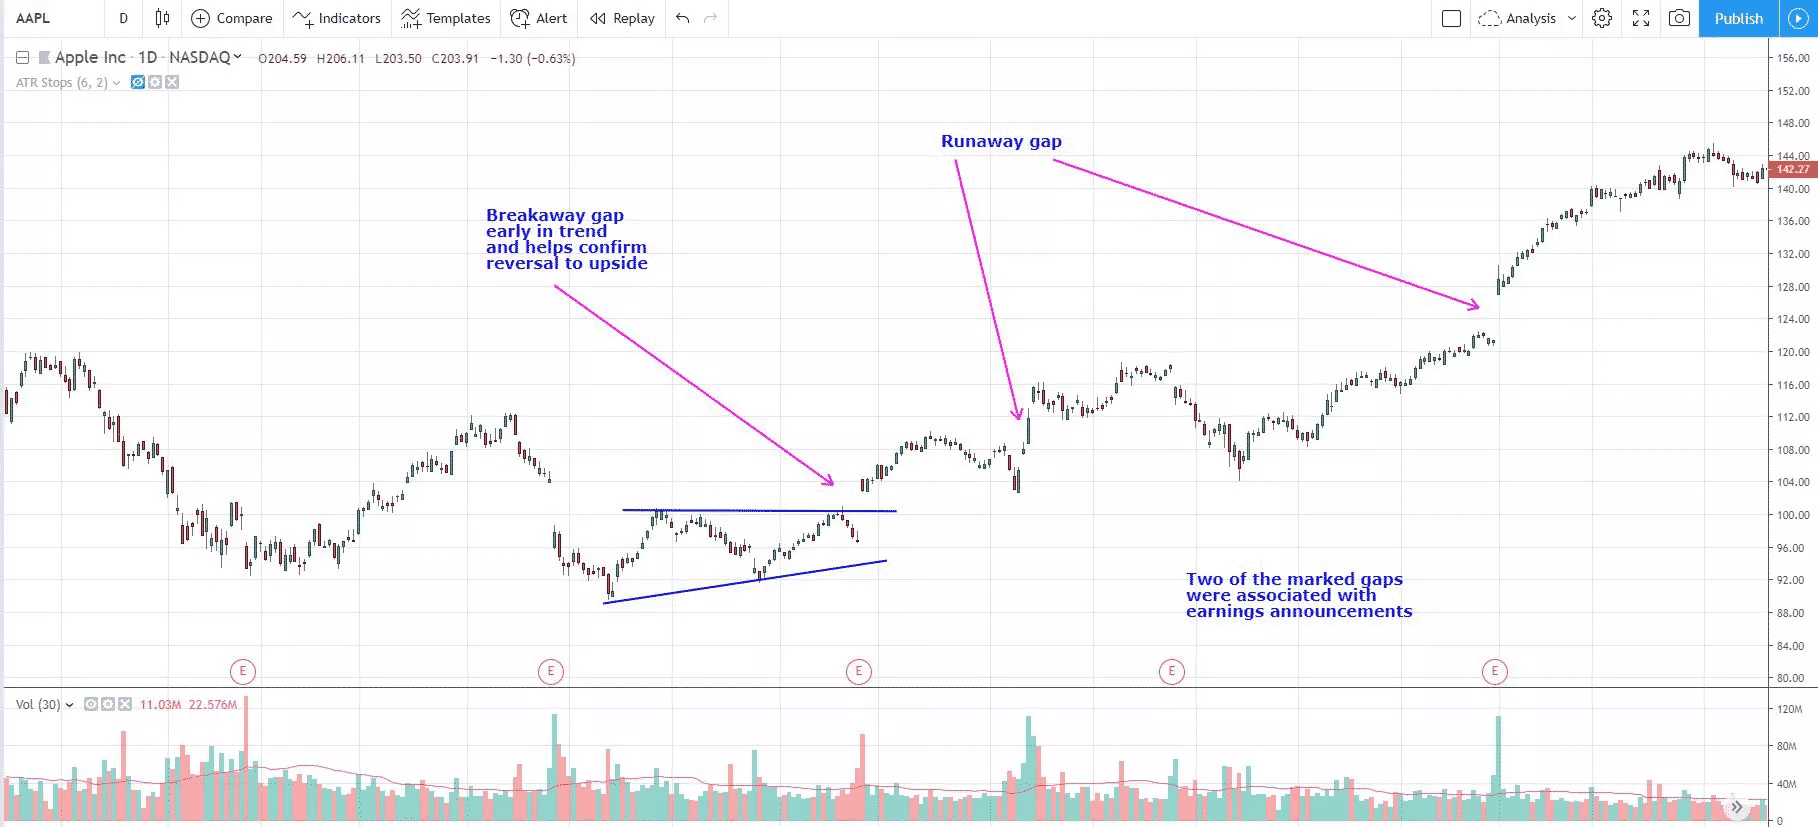
The chart below showing AAPL has three gaps marked on it.
The first comes when the price forms a triangle pattern after a downtrend.
The price then gaps above the triangle, on high volume, and then continues to rally to the upside.
This is a breakaway gap associated with an earnings announcement.
During the ensuing uptrend, the price also experienced some runaway gaps.
The first runaway gap was not associated with earnings.
The second runaway gap marked on the chart was associated with earnings.
These gaps all occurred on high volume.
Runaway Gaps (Continuation Gaps)
Runaway gaps usually occur during a strong trend and indicate that the trend is strong enough to indicate the trend is strengthening.
They are usually large gaps with price movement that keeps on moving in the trend direction for an extended period.
A runaway gap occurs when trading activity skips sequential price points, usually driven by intense investor interest.
It is normally defined as a gap of 5% or more that occurs in the direction of a current trend and is usually accompanied with higher-than-normal trading volume.
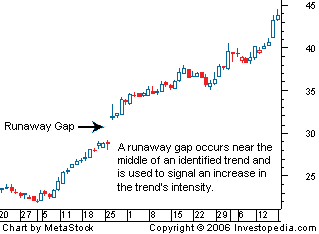
Image Credit: Investopedia
The psychology behind a runway gap is that traders, who did not get in during the initial move get tired of waiting for a retracement, join in what they perceive to be a trending market, and jump in en masse.
This sudden buying or selling interest happens quickly, usually accompanied by an unexpected news story, which forces the market maker to place the bid / ask at price points that are farther away from the last traded price prior to the gap forming.
The eagerness of traders to engage, sometimes bordering on panic, leads them to trade at these wide price levels, which results in the security’s price jumping up, or down, leading to the formation of the runaway gap.
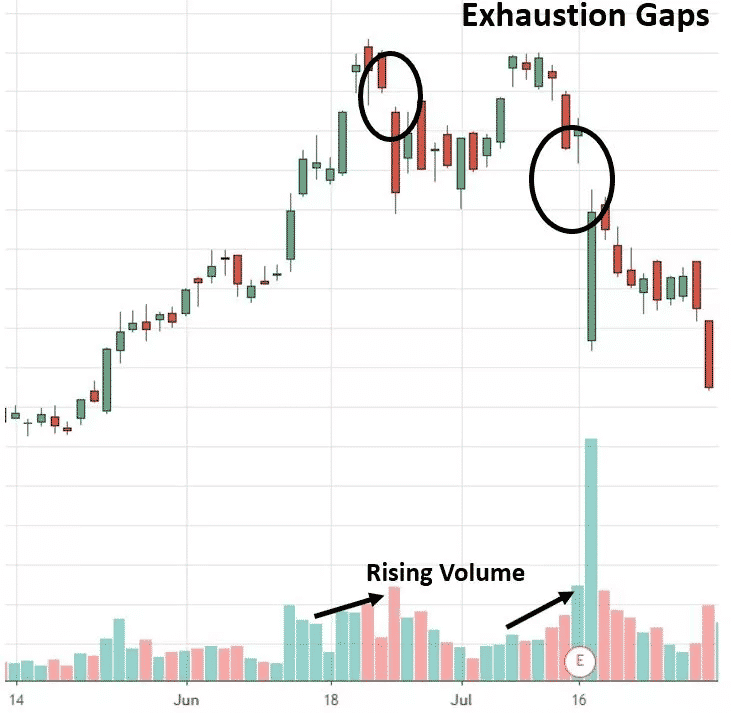
Exhaustion Gaps
As a trend draws to a close, it may experience an exhaustion gap.
An exhaustion gap occurs near the end of a trend and is caused by a final group of buyers, who regret not having bought prior, jumping in.
In a downtrend, an exhaustion gap is a gap caused by sellers.
An exhaustion gap is similar to a runaway gap, except that an exhaustion gap is usually associated with very high volume as opposed to higher-than-average volume associated with a runaway gap.
Traders can expect exhaustion gaps to fill quickly.
Since an exhaustion gap usually occurs near the end of the trend, any progress the gap made is usually erased (gap filled) within a few weeks and often within several days.
The gap day shows that sellers aggressively entered the market and seemed more concerned with getting out at all costs rather than preserving a good price for the stock.
Thus, the day after, the gap opens higher and closes lower, leaving a large, red-colored candle, depicting a tremendous amount of selling that day.
The second example circled on the chart does not occur directly after the peak in prices, but it clearly violates the trend line and sets the stage for significant price drops thereafter.
Disclaimer: The information above is for educational purposes only and should not be treated as investment advice. The strategy presented would not be suitable for investors who are not familiar with exchange traded options. Any readers interested in this strategy should do their own research and seek advice from a licensed financial adviser.


