
Contents
In the last article, we showed a trade that had a profit of $213 that looked like this. Instead of closing the trade and taking the profit, we can turn it into a black swan hedge.
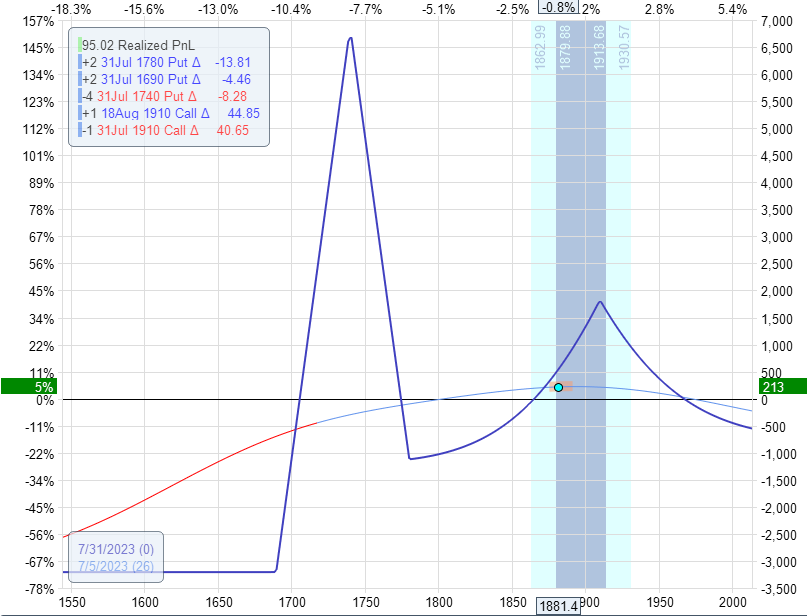
For example, first, sell the calendar:
Buy to close July 31 RUT 1910 call
Sell to close Aug 18 RUT 1910 call
Credit: $890
That leaves us with a two-lot broken-wing-butterfly with strikes in 1780/1740/1690.
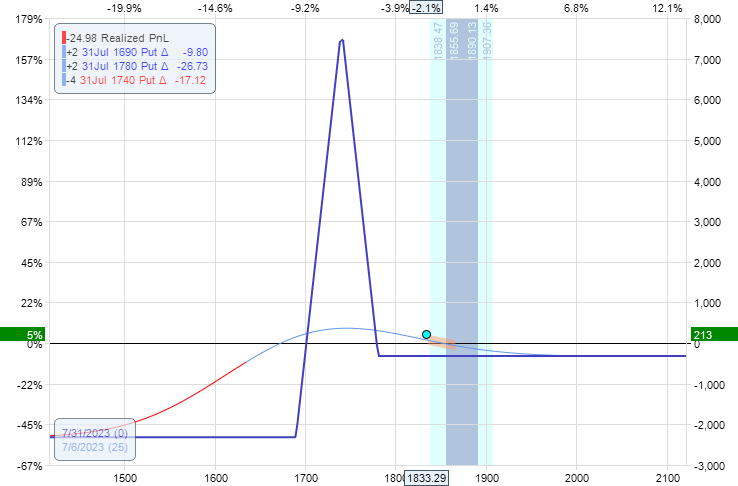
We have two long puts at 1780.
Four short puts at 1740.
And two long puts at 1690.
We end up with a downside hedge by selling parts of it and leaving a few pieces behind.
For example,
Sell to close two July 31 RUT 1740 put @ $9.85
Buy to close three July 31 RUT 1780 put @ $17.10
Net credit: $465
That leaves us with one short put at 1740 and two long puts at 1690, which results in a graph that looks like this:
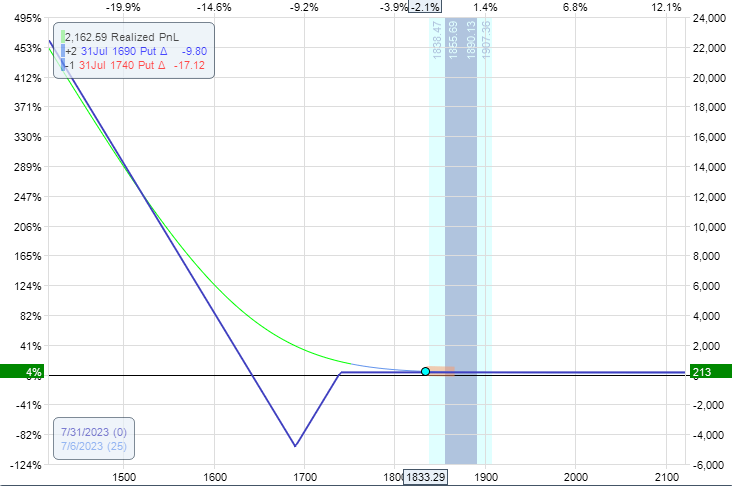
The trade has no upside risk.
If the price stays where it is or goes up, we see that the expiration graph is above the horizontal zero line.
If the market goes down significantly, this trade can make a lot of money – in theory, it has unlimited profit potential.
The likelihood of the market crashing is slim, but it can happen.
The sighting of a black swan is slim, but it can happen.
If the market crashes, this trade will make money to offset losses in other bullish trades.
That is why it is called a “black swan” hedge.
Frequently Asked Questions
How much is this black swan hedge worth?
It is worth the peace of mind that one gets knowing that if the market crashes, it will offset some of the losses of the long portfolio or bullish trades.
How much monetary value is this black swan hedge worth?
We can determine this by seeing how much credit we would get if we were to sell this remaining position.
The answer is $65.
It is up to the trader whether they want to take the $213 profit and close out the entire butterfly/calendar trade.
Or close all but $65 worth of it.
That leaves the trader with an insurance policy if the market crashes.
But if it does not crash and SPX stays where it is or higher, the net profit will be $213 less the $65 or $148.
The blue expiration graph on the right-hand side is $148 above the zero-profit horizontal.
Can the hedge lose money?
Yes, it can because the expiration graph dips all the way down to -$4852 if SPX is at $1690 at expiration.
This is known as the Valley of Death.
But that only occurs if you hold the trade to expiration.
The trade right now has 25 days till expiration.
If we turn on the other time projection lines:
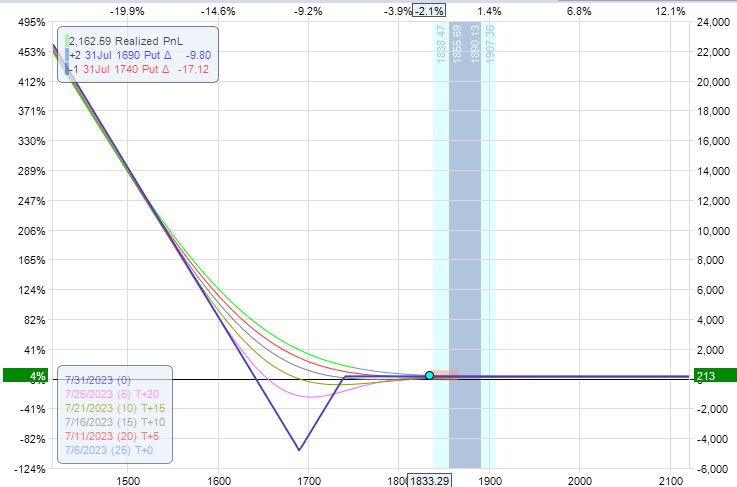
We can estimate that we can stay in the trade for ten more days before the T-line starts dipping down into the valley of death. Therefore, just get out of the trade before then.
The shape of the graph reminds me of another option strategy.
What is it?
The put-back ratio spread consists of one short put and two long puts at a lower strike.
Conclusion
The conversion of a broken-wing-butterfly into a put-back ratio spread works best when the underlying price is running up away from the butterfly, and the trade already has some profits.
You are giving up some of that profit in order to have the peace of mind that you have a black swan hedge in place.
It may seem like you are getting a free “black swan hedge.”
But in the options world, nothing is free.
In this example, you give up $65 to buy this black swan hedge.
The comfort is that this $65 comes from the profits already in the trade.
We hope you enjoyed this article on this black swan hedge.
If you have any questions, please send an email or leave a comment below.
Trade safe!
Disclaimer: The information above is for educational purposes only and should not be treated as investment advice. The strategy presented would not be suitable for investors who are not familiar with exchange traded options. Any readers interested in this strategy should do their own research and seek advice from a licensed financial adviser.


I think there may be a mistake on this page (believe it or not):
It says to:
• Sell to close two July 31 RUT 1740 put
• Buy to close three July 31 RUT 1780 put
but that’s impossible because these are the positions that are open:
• 2 long puts at 1780
• 4 short puts at 1740
• 2 long puts at 1690
You are spot on Norm. Thanks for point out my typo. It’s fixed now.