

Contents
- Introduction
- What Is A Bear Put Spread?
- Maximum Loss
- Maximum Gain
- Breakeven Price
- Payoff Diagram
- Risk of Early Assignment
- How Volatility Impacts The Trade
- How Time Decay Impacts The Trade
- Risks
- Bear Put Spread vs Bear Call Spread
- Short-Term vs Long-Term Bear Put Spreads
- Bear Put Spread Examples
- Summary
Introduction
A bear put spread is a vertical spread that aims for profit from a stock declining in price. It has a directional bias as hinted in the name.
Unlike the bear call spread, it suffers from time decay so traders need to be correct on the direction of the underlying and also the timing.
What Is A Bear Put Spread?
A bear put spread is an options strategy that a trader uses when they are seeking to profit from what they believe will be a moderate decrease in the price of the underlying stock.
To execute the strategy, a trader would buy an in-the-money put option whilst simultaneously selling an out-of-the-money put option with the following conditions:
- Both put options must use the same underlying stock
- Both put options must have the same expiration
- Both put options must have the same number of options
- The in-the-money put must have a higher strike than the out-of-the-money put
Since the in-the-money put will be more expensive than the out-of-the-money put at the lower strike price, it means your opening position is negative so you will have a net debit.
The bear put spread profits as the stock price falls, but profits are capped due to the out-of-the-money put.
Although profits are capped, this strategy is useful as it enables a trader to reduce the cost of establishing a bearish position to take advantage of more moderate falls.
Losses are also capped, in this case by the debit taken when you execute the trade.
This means the strategy has limited risk as well as limited profit potential.
Given its nature, the strategy is generally used when the market is in a downward trend.
Maximum Loss
Maximum loss occurs when the underlying stock price rises above the in-the-money put option strike price at the expiration date.
When this occurs, the trader loses a sum equal to the initial debt that was taken when the trade was executed.
To calculate the maximum loss, use the following formulas:
Maximum Loss = Net Premium Paid + Commissions Paid
Which occurs when:
Price of Underlying >= Strike Price of the Long Put
As an example, imagine you come across a stock (ABC company) that you believe is going to decline in price soon by a moderate amount so you want to use a bear put spread strategy.
It’s currently trading at $54 so you buy a put at 56 for $300 and write a put at 50 for $100.
For executing the trade, you receive a net debit of $200 which is the spread (the difference between the higher strike and lower strike).
Unfortunately, it turns out you were wrong about the bearish move and the price of ABC rallies to $58.
As a result, both options will expire worthless and sustain the maximum possible loss, which is to lose the initial debit of $200.
Maximum Gain
The maximum gain occurs when the underlying stock price falls and closes below the strike price of the out-of-the-money puts on the expiration date.
When this occurs, both options expire in-the-money.
Since the higher strike put will have a higher intrinsic value than the lower strike put that you sold, you will make a profit.
The maximum gain you make will be equal to the spread less the initial debit you incurred when executing the trade.
The greater the spread between the higher strike price and the lower strike price, the greater the gains you can make.
To calculate the maximum gain, use the following formulas:
Maximum Gain = (Strike Price of the Long Put – Strike Price of the Short Put) – Net Premium Paid – Commissions Paid
Which can only be achieved when:
Price of Underlying <= Strike Price of the Short Put
Using our earlier example of ABC stock trading at $54, say we were right about the price declines and the stock closes at $48 on the expiration date.
Both puts will, therefore, expire in-the-money with the 56 put having $800 in intrinsic value and the 50 put having $200 in intrinsic value.
Taking the spread and subtracting the initial $200 debit taken when the trade was executed, your net profit will be $400.
Breakeven Price
Breakeven is found by applying the following formula:
Breakeven Price = Strike Price of the Long Put – Net Premium Paid
Payoff Diagram
Looking at the Payoff Diagram, we can see that above the higher strike price, both options are out-of-the-money and so the total cost is constant and equal to the initial cost of the trade (i.e. debit).
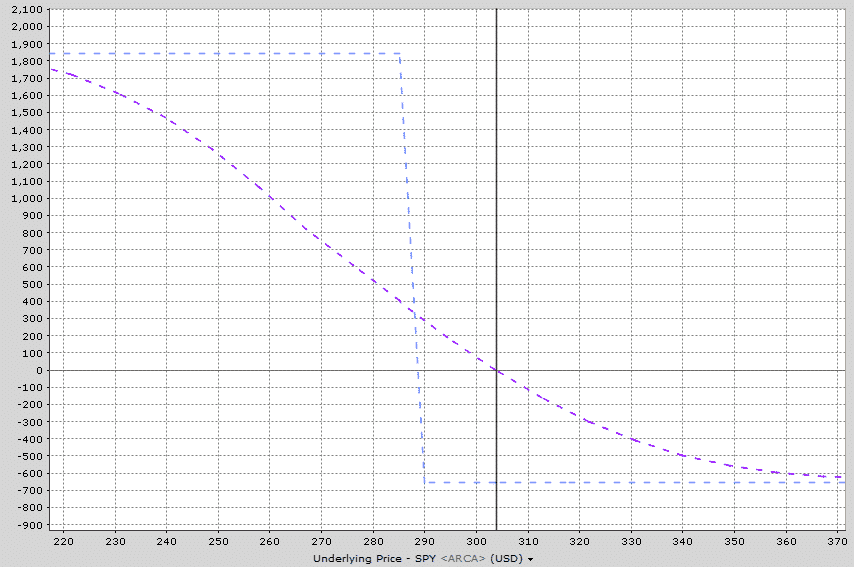
Between the higher strike price and the lower strike price, the profit grows as the underlying price decreases.
Finally, when the price moves below the lower strike price, both options are in-the-money and their value continues to rise as the underlying price decreases, although they’re offset by each other.
Risk of Early Assignment
The risk of early assignment with a bear put spread is typically low. Generally, trader will buy a bear put spread that is out-of-the-money and therefor unlikely to suffer assignment on the short put.
In the unlikely event that the short put was assigned, the position would be covered by the long put in any event.
The only time assignment is likely to happen is if the trade has gone deep in-the-money and is close to expiry.
How Volatility Impacts The Trade
Volatility will not have a huge impact on bear put spreads. The long put will benefit from rising volatility and the short put will benefit from falling volatility.
Therefore, the two tend to mostly offset each other.
That being said, the impact of volatility can depend on where the stock is trading in relation to the strikes in the bear put spread.
Vega is the greek that measures a position’s exposure to changes in implied volatility. If a position has negative vega overall, it will benefit from falling volatility.
If the position has positive vega, it will benefit from rising volatility. You can read more about implied volatility and vega in detail here.
Usually a bear put spread will have positive vega, meaning that the position will benefit from a rise in implied volatility after trade initiation. However, if the position is in-the-money, it will likely have negative vega as shown below.
How Time Decay Impacts The Trade
Time decay can vary depending on where the underlying stock is trading. Traders placing a standard out-of-the-money bear put spread will start their trade with negative theta.
This means they will lose money from time decay as time passes, with all else being equal.
If the stock trades below the sold put, the position will switch to having positive time decay and the passage of time will help the trade.
You can see this occurring in the two examples in the above section.
DELTA
Being a bearish trade, the delta of a bear put spread will always be negative no matter what stage of the trade you are in or how it is set up. This can be seen above.
The trade does well when prices fall. Pretty obvious, right?
What else do we need to know about delta when it comes to trading bear put spreads?
Well, delta can be used as a rough approximation of the probability of the underlying stock reaching a certain level. For example, if we buy a 10-delta put, there is a roughly 10% chance of that put option expiring in-the-money.
Now, unfortunately it’s not quite that simple, that’s why I said roughly a 10% chance. It’s not an exact science and there are many different variables that go into the options pricing model.
Delta can be used as an estimate of probability and is certainly useful to know. But, don’t assume that if you sell 20 delta puts you are going to win 80% of the time. It doesn’t work out that way in real life.
Be aware of the limitations of using delta as a probability.
You can learn more about delta here.
GAMMA
Gamma is one of the lesser known greeks and usually, not as important as the others. I say usually, because you’ll see further down in this post why it can be really important to understand gamma risk.
I won’t go into too much detail on gamma here, because it will be explained in more detail below when we compare long-term and short-term bear put spreads.
Risks
It goes without saying that as a bearish trade, we have a risk that the price of the underlying will rise causing an unrealized loss, or a realized loss if we close the trade.
If the stock doesn’t make the predicted move, the trader has the potential to lose 100% of the capital invested in the trade.
Out-of-the-money bear put spreads will lose value from time decay, so if the down move doesn’t occur quickly enough, the trader can still lose money, even if the stock does eventually move lower.
If the stock makes a sharp move lower, the trade will be profitable, but not as profitable as trading a pure long put.
Bear Put Spread vs Bear Call Spread
Both trades are bearish trades with one using puts and the other using calls (obviously).
Bear put spreads tend to be more of a speculative trade where the trader places the spread out-of-the-money and aims to achieve a large return for the given capital at risk.
A bear call spread trader on the other hand is trying to generate an income from the trade and hopes that the stock declines, stays flat or doesn’t rise by too much.
Bear put spreads that are placed out-of-the-money will only profit if the stock declines. Sometimes that decline will need to be by a significant amount.
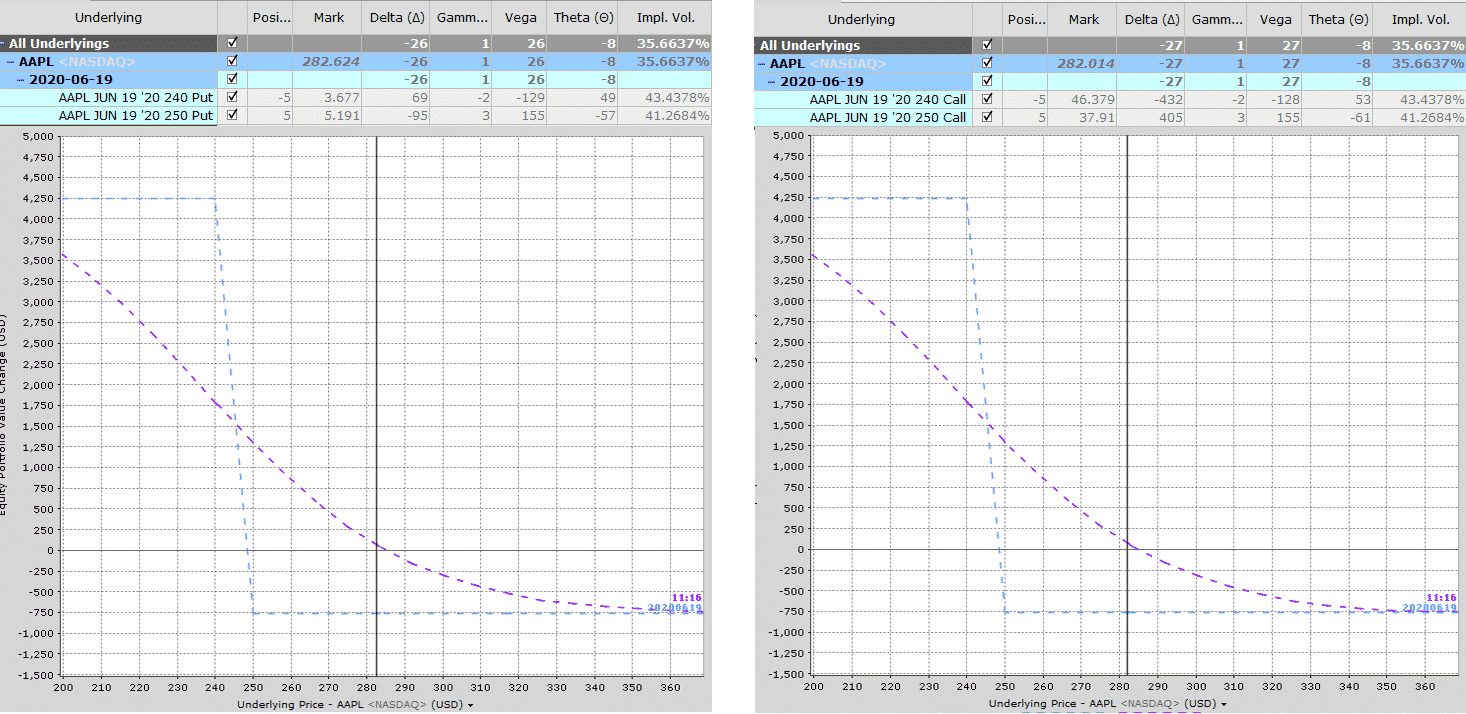
You can see below that it doesn’t matter whether you trade the bear put spread or the bear call spread, the outcomes are fairly similar.
The main difference would be that the bear call spread is short an in-the-money call and would therefore be exposure to assignment risk.
Short-Term vs Long-Term Bear Put Spreads
As discussed in previous articles, short-term trades have very high gamma, which means they are very sensitive to changes in price.
Trades with high gamma will see their delta change at a much faster rate than low gamma trades.
If you want a full tutorial on gamma, you should read this article.
Long-term trades have a much lower gamma and therefore are not as sensitive to changes in price.
Let’s compare a short-term and a long-term bear put spread:
Here we have a couple of SPY bear put spreads at $290-285. The first trade has a duration of 74 days to expiry and the second trade has 193.


These greeks are all fairly similar which is actually kind of surprising.
Bear Put Spread Example
Let’s see how the above out-of-the-money bear put spread works out.
OUT-OF-THE-MONEY SPREAD
Date: June 5, 2020
Price: SPY @ $319.38
Sell five Aug 21 SPY $285 Put @ $4.78
Buy five Aug 21 SPY $290 Put @ $5.508
Net debit: $364
Max risk: $364 (plus commissions)
Max gain: $2136
Risk-to-reward: 0.2
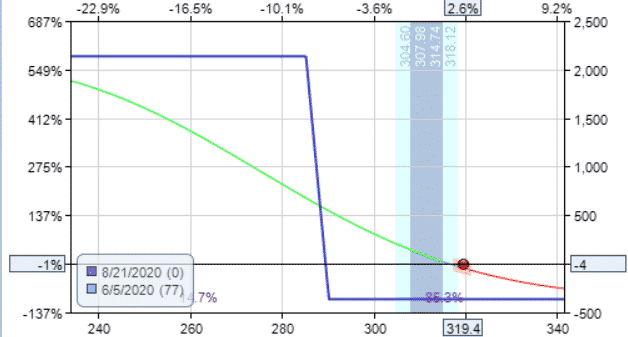
Suppose the investor has a trading plan to take profit if it reaches 75% return on the initial capital invested.
And exit with a stop loss of when half the initial capital investment has been lost.
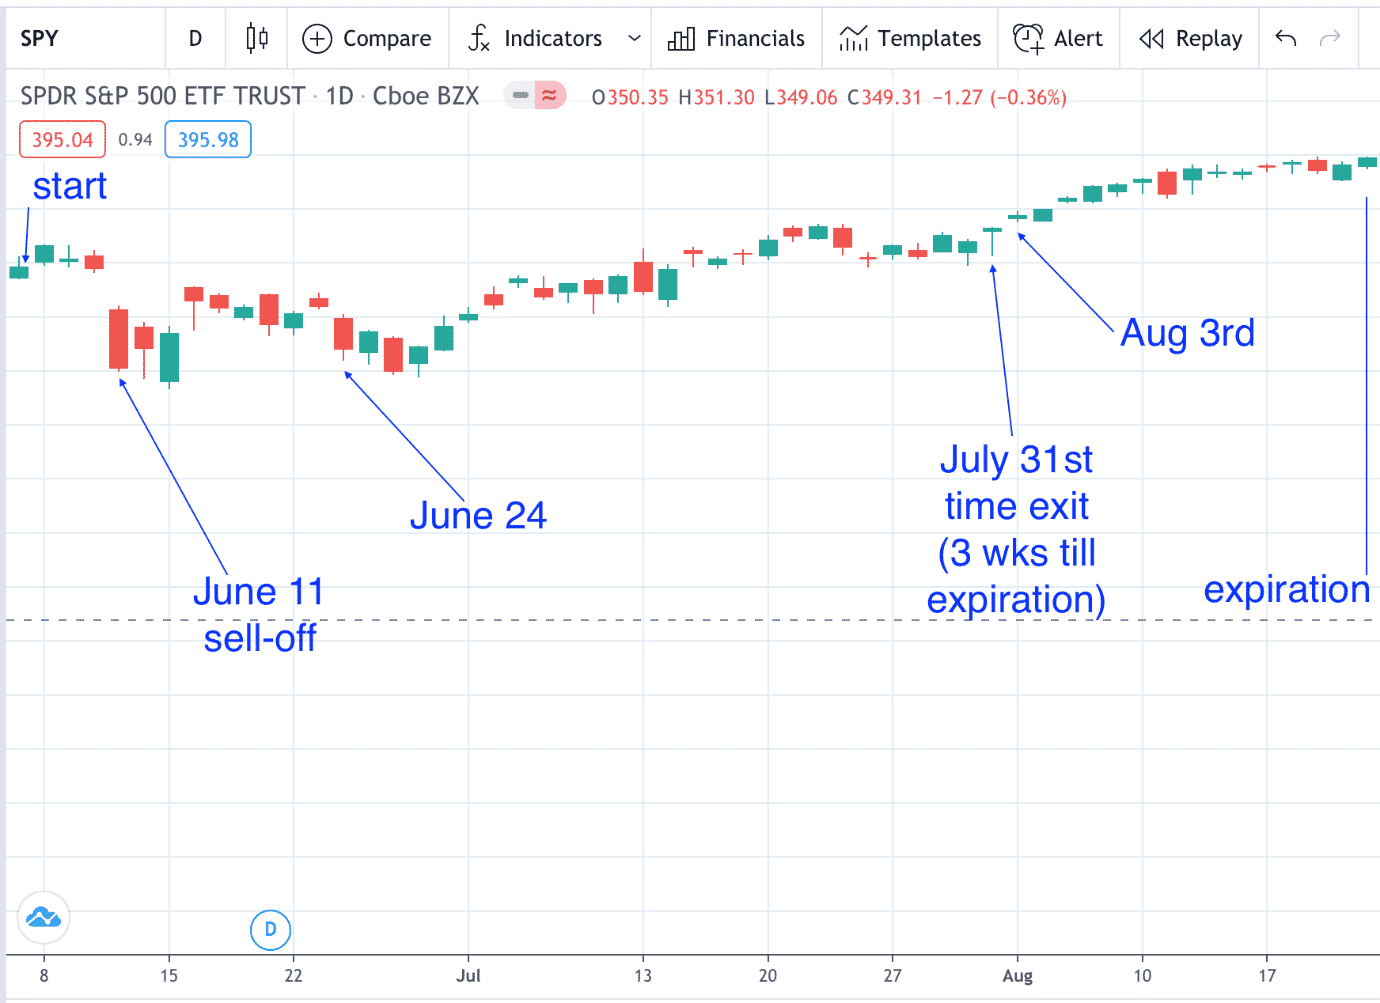
On June 11, there was a market sell-off which resulted in a profit of $377.50, just over 100% return on the initial capital invested.
The investor can certainly take profit at this time.
But a more aggressive investor may want to shoot for a 200% return on capital.
In this case, it would be a profit target of $728, which is certainly possible, since the max gain on this spread is $2136.
For this trader, there is no mental stop loss. Since this is a defined-risk strategy, the max risk on the spread is the stop loss.
It turns out that the profit target of $728 was never reached because SPY did not sell-off enough during the duration of the trade.
This investor would have had the max loss of $364 with both puts expiring out-of-the-money worthless on expiration August 21st.
IN-THE-MONEY SPREAD
Now let’s see how the in-the-money spread turns out in the same market conditions.
Sell five Aug 21 SPY $335 Put @ $21.18
Buy five Aug 21 SPY $340 Put @ $24.80
Net debit: $1811
Max risk: $1811 (plus commissions)
Max gain: $689
Risk-to-reward: 2.6
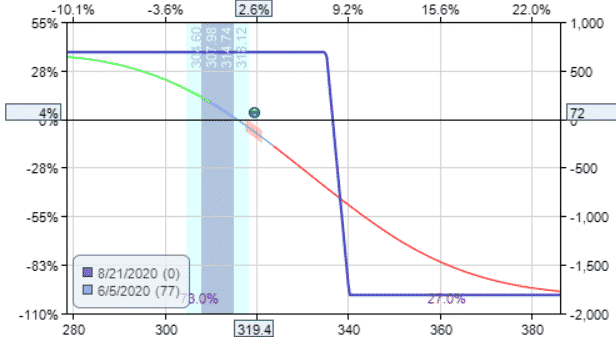
During the sell-off on June 11, this spread made $311.50 in profits. That is a 17% return on the initial capital invested.
The investor can certainly take profit at this time.
But suppose the investor has the plan to take profit at 50% of max gain, in this case, $344.
And will stop the loss if it losses more than $688.
Based on this plan, the profit target was reached on June 24 when the spread showed a profit of $404.
This investor planned the stop to be twice the take profit level, which means that the investor needs to win at least twice as much as he or she losses to be profitable.
By giving the stock “room to move” and not having stops so tight, it increases the probability of the profit target being hit.
The probability of profit being hit is also highly dependent on this investor’s ability to correctly read the directional bias of the stock movement.
Based on the individual’s historical trade logs, this probability of profit needs to be determined to set the correct take profit and stop loss level for the individual trader so that an optimized positive expectancy is achieved.
AT-THE-MONEY SPREAD
You have seen how the trading style of the out-of-the-money spread is different from that of the in-the-money spread.
A hybrid of the two is the at-the-money spread where one put is in-the-money and the other put is out-of-the-money.
Date: June 5, 2020
Price: SPY @ $319.38
Sell five Aug 21 SPY $317 Put @ $11.86
Buy five Aug 21 SPY $322 Put @ $13.86
Net debit: $1000
Max risk: $1000 (plus commissions)
Max gain: $1500
Risk-to-reward: 0.67
This spread has a reward-to-risk of 1.5.
Investor “A” plans to let the trade play out till expiration and either receive the max loss or max gain or somewhere in between.
Investor “B” plans to exit three weeks before expiration on a timed stop and take whatever profit or loss is at that point.
Investor “C” plans to take profit at 75% return on capital invested, which is $750. And stop loss when half the initial investment is lost, which is $500.
Investor “D” plans to take profit at 50% return on capital invested, which is $500. And to stop loss when 75% of the initial investment is lost, which is $750.
While we all know that we cannot judge a strategy with just one trade, the results of this particular trade are:
Investor “A” had the max loss of $1000 at expiration on Aug 21.
Investor “B” lost $402.50 (or 40%) when exiting on July 31.
Investor “C” lost $502.50 (or 50%) when the stop loss was hit on Aug 3.
Investor “D” profited $510 (or 50%) when the profit target was reached on Jun 11.
Summary
- Bear put spreads are defined risk, defined profit trades.
- Most traders place these out-of-the-money and are looking for a large gain on a small amount of capital. In this case, they need the stock to make a big move lower to be profitable and offset the impact of time decay
- P&L on short-term trades will fluctuate much more than on long-term trades.
Trade safe!
Disclaimer: The information above is for educational purposes only and should not be treated as investment advice. The strategy presented would not be suitable for investors who are not familiar with exchange traded options. Any readers interested in this strategy should do their own research and seek advice from a licensed financial adviser.


your last 2 tables are the same so Greeks look exactly the same of course
Thanks, fixed now.