


Contents
By most indicators, the market on June 16, 2023, is extended. What does that mean?
It means that the market has gone higher than expected on the upside.
In this context, “extended” means “beyond” the average range.
We use this term in the market only if prices are beyond their normal values on the upside – not on the downside.
If the market went down beyond its normal range, we would probably say it is a market crash instead, or at least a pull-back.
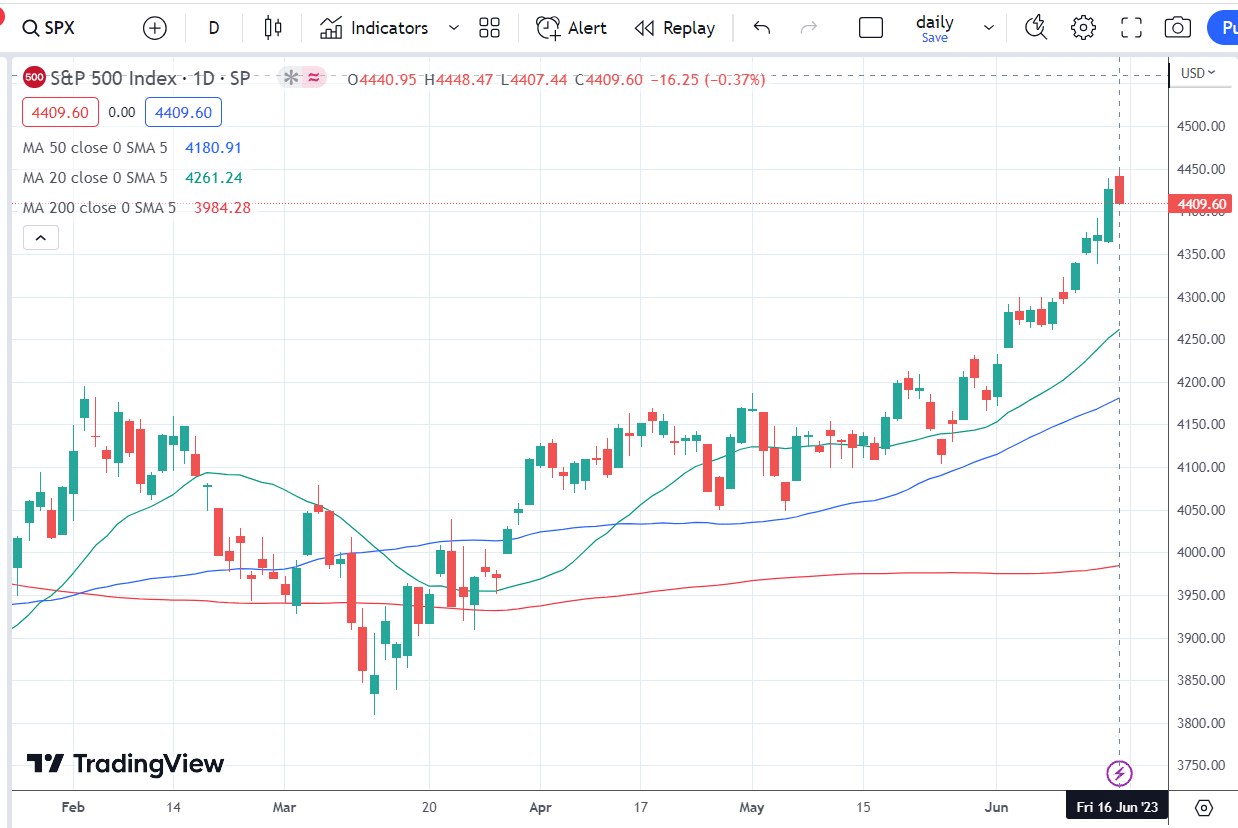
On June 16, let’s look at how much the SPX (S&P 500 index) is above the 20-day moving average (green line), the 50-day moving average (blue line), and the 200-day moving average (red line).
analyzing the market
That’s pretty high up there.
The last red candle on Friday, June 16, which coincides with quadruple witching, suggests sellers are entering the market.
SPX opened at a high of 4448; at the end of the day, it was down at 4407.
Some investors feel that a pullback may be imminent.
Let’s look at move indications first.
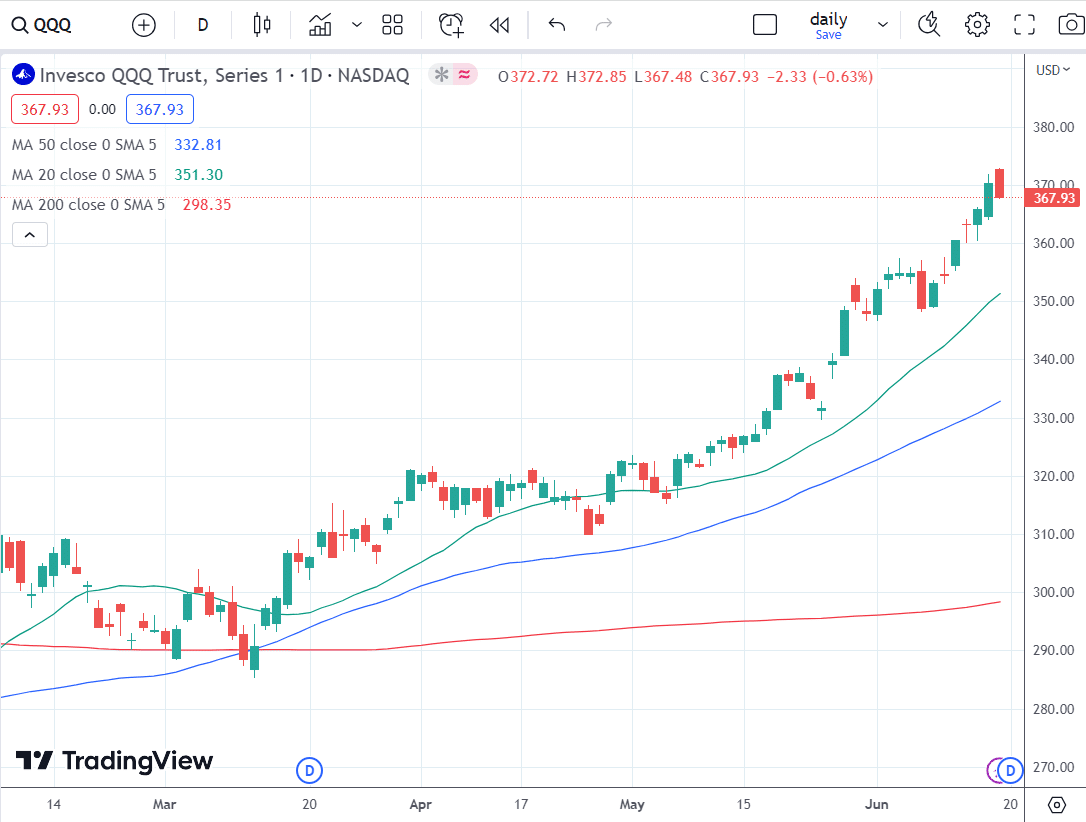
The QQQ (Nasdaq ETF) shows similar behavior.
The DIA (Dow Jones ETF) also had a down day but does not have as great of a run-up in price as the 20-day moving average is still behind the 50-day moving average.
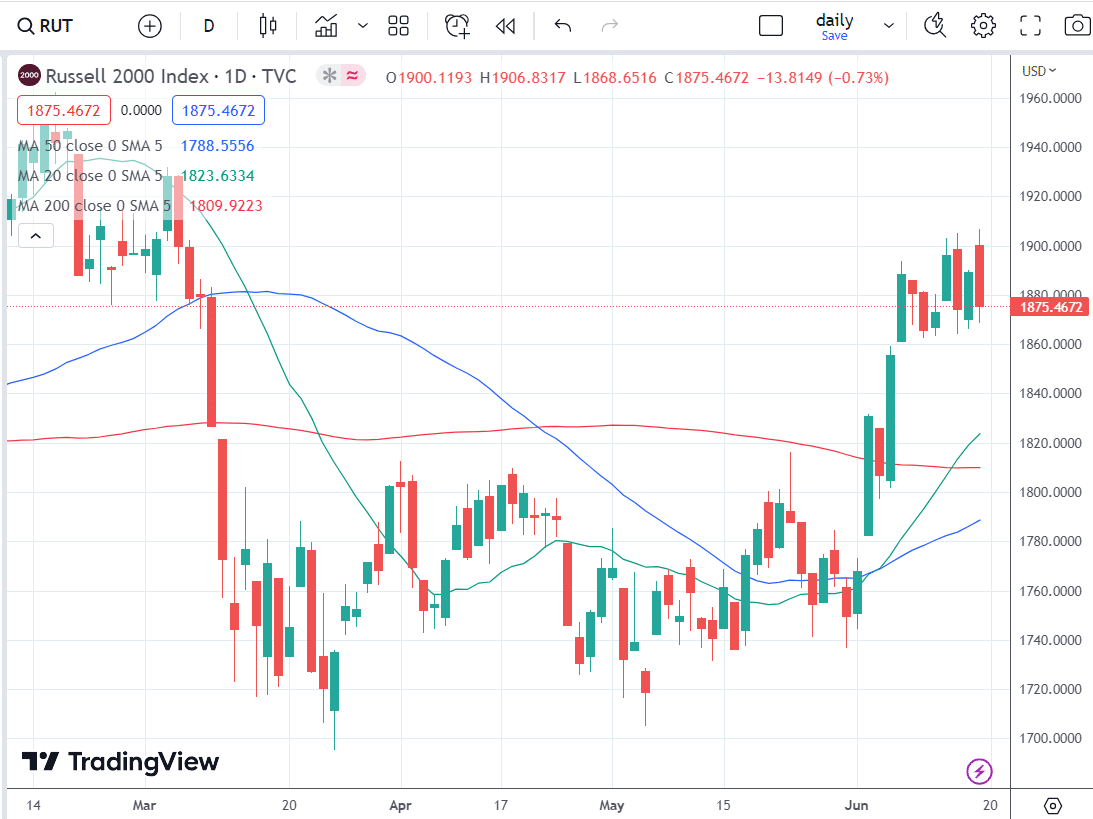
The RUT (Russell 2000 index) is in a consolidation range.
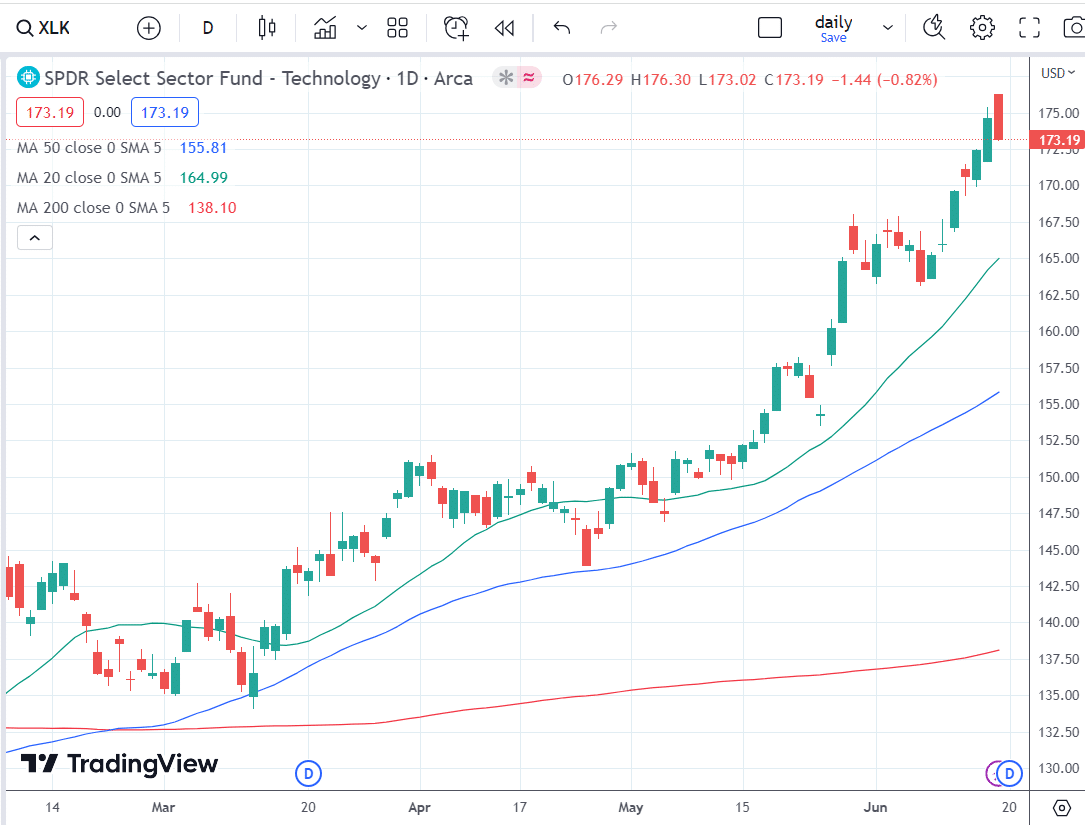
Looking at some of the sector ETFs, we see that the technology sector (XLK) shows the greatest price run-up.
It is the most “extended.”
Adobe (ADBE) is one of the holdings within XLK.
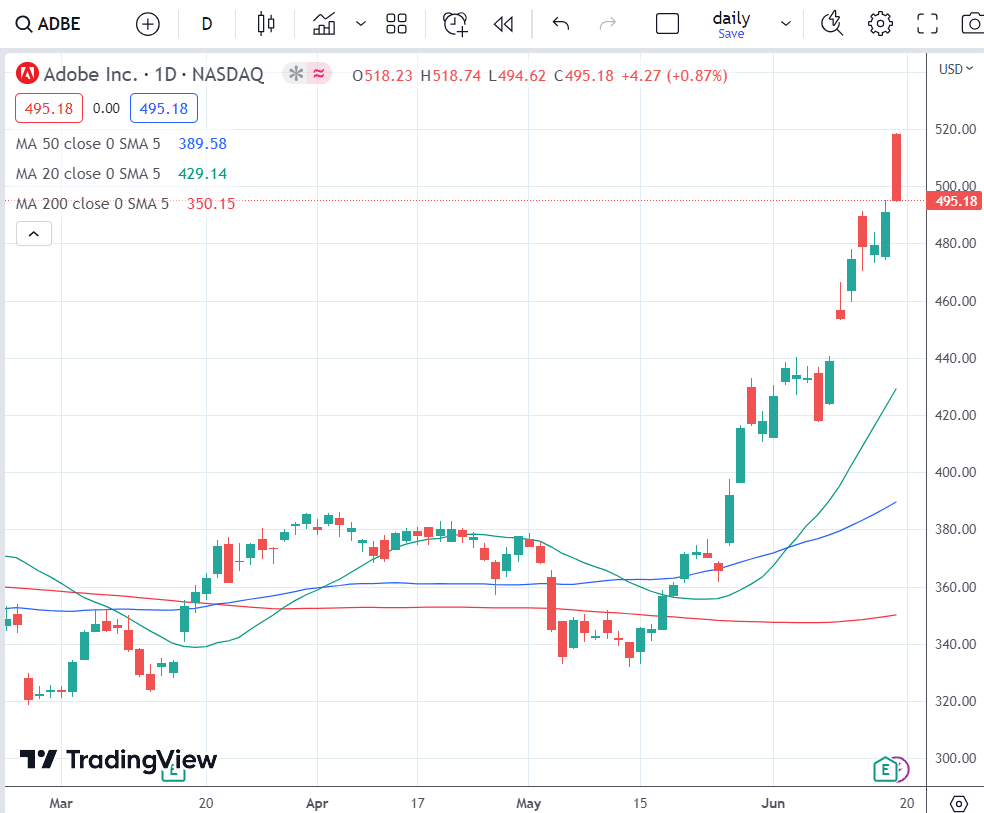
ADBE gapped up from the previous close of $490.91 to $518.23 on Friday’s market open.
Then it went down the whole day to close at $495.18, near the day’s low.
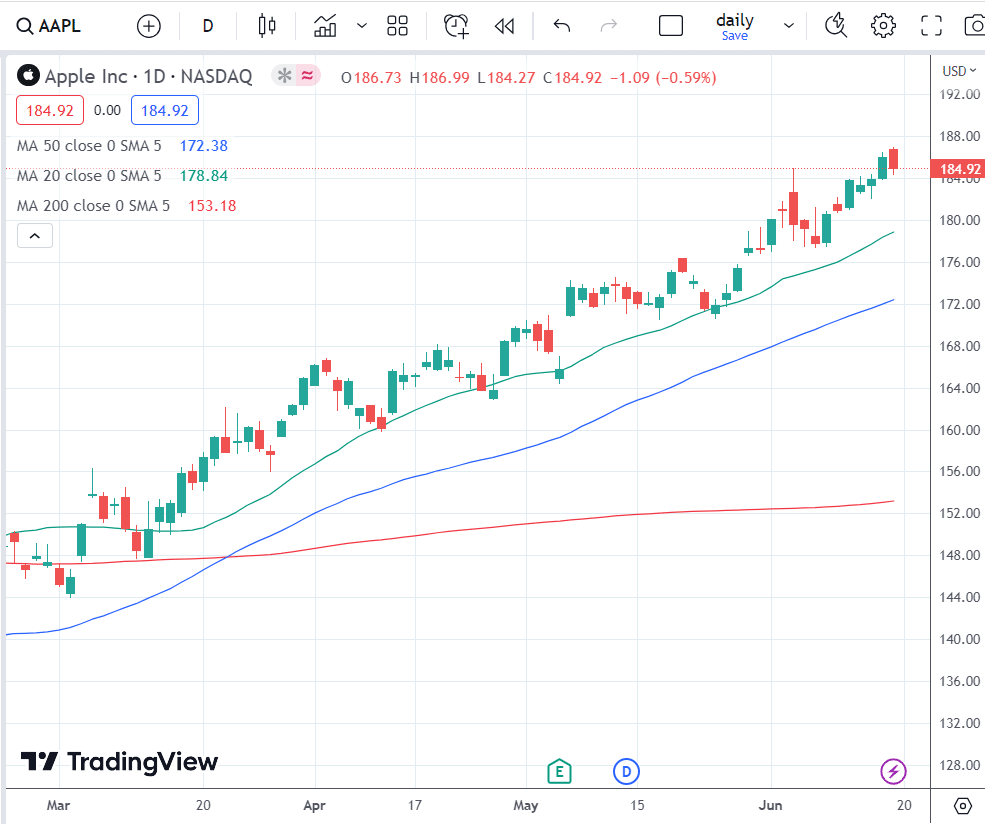
Apple (AAPL) is also part of the XLK ETF.
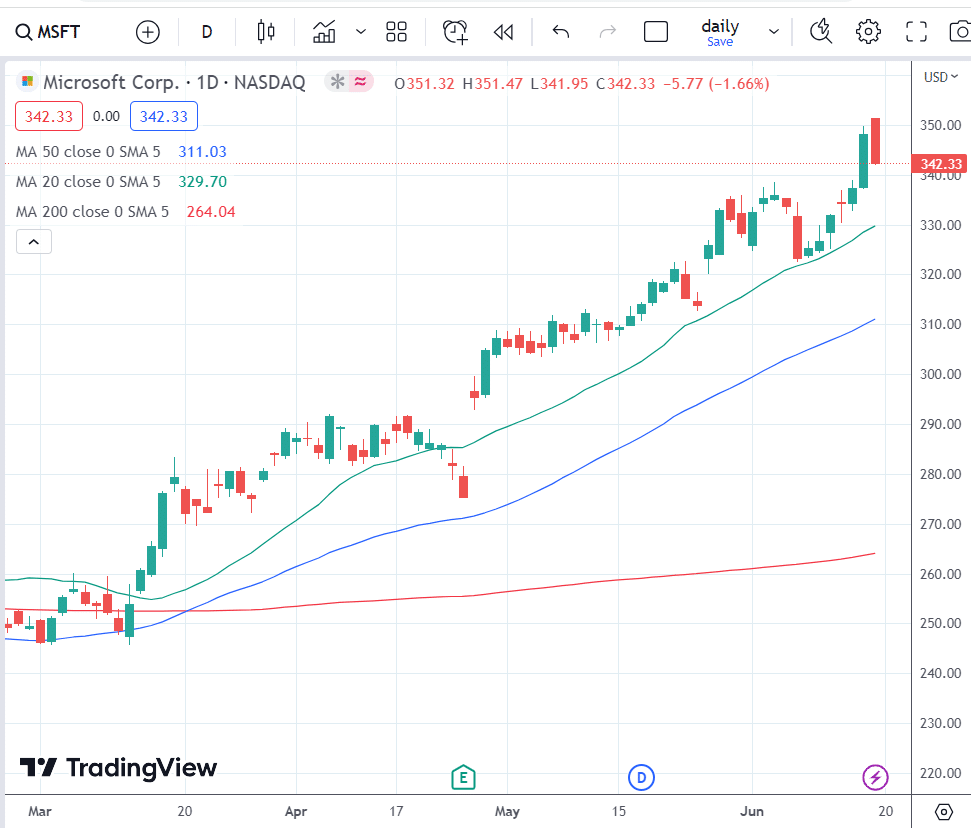
As is Microsoft (MSFT).
Bollinger Bands and RSI
With Bollinger Bands and RSI turned on in the chart of SPX.
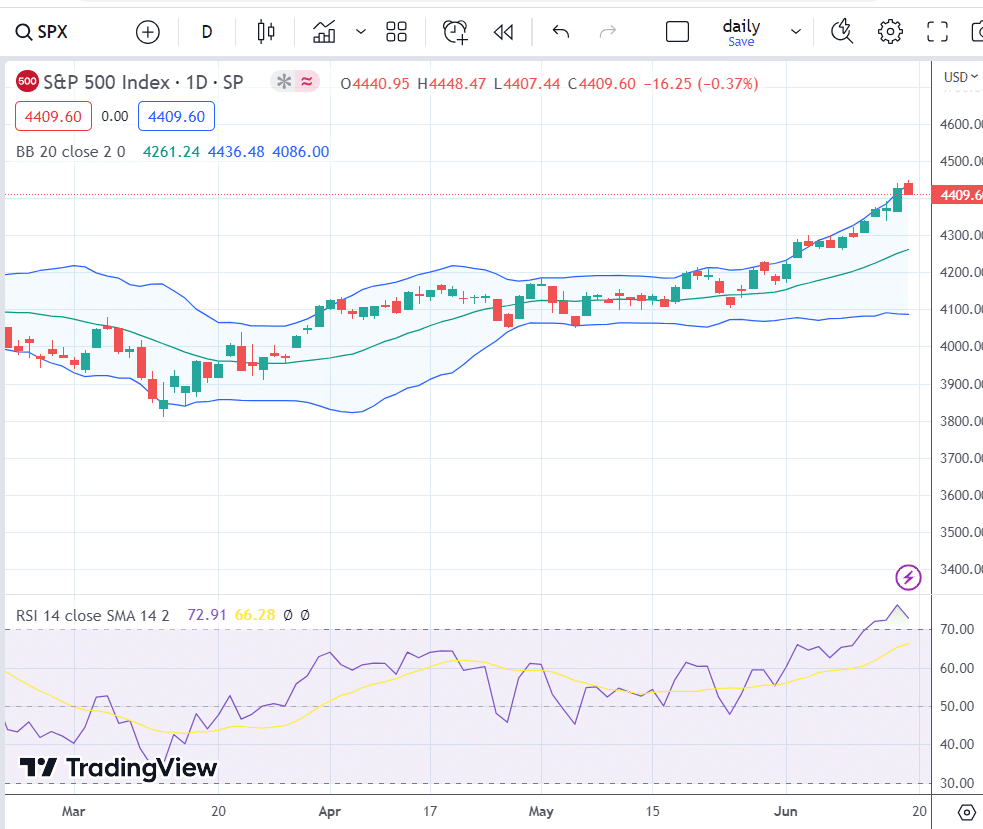
We see that the price is hugging the upper Bollinger Bands, which have widened considerably.
Usually, when Bollinger bands widen, they will eventually become narrow.
And when they narrow, then they will eventually widen.
The RSI is above 70, which indicates that the price is in an overbought condition.
Keltner Channel and CCI are depicted on the SPX chart.
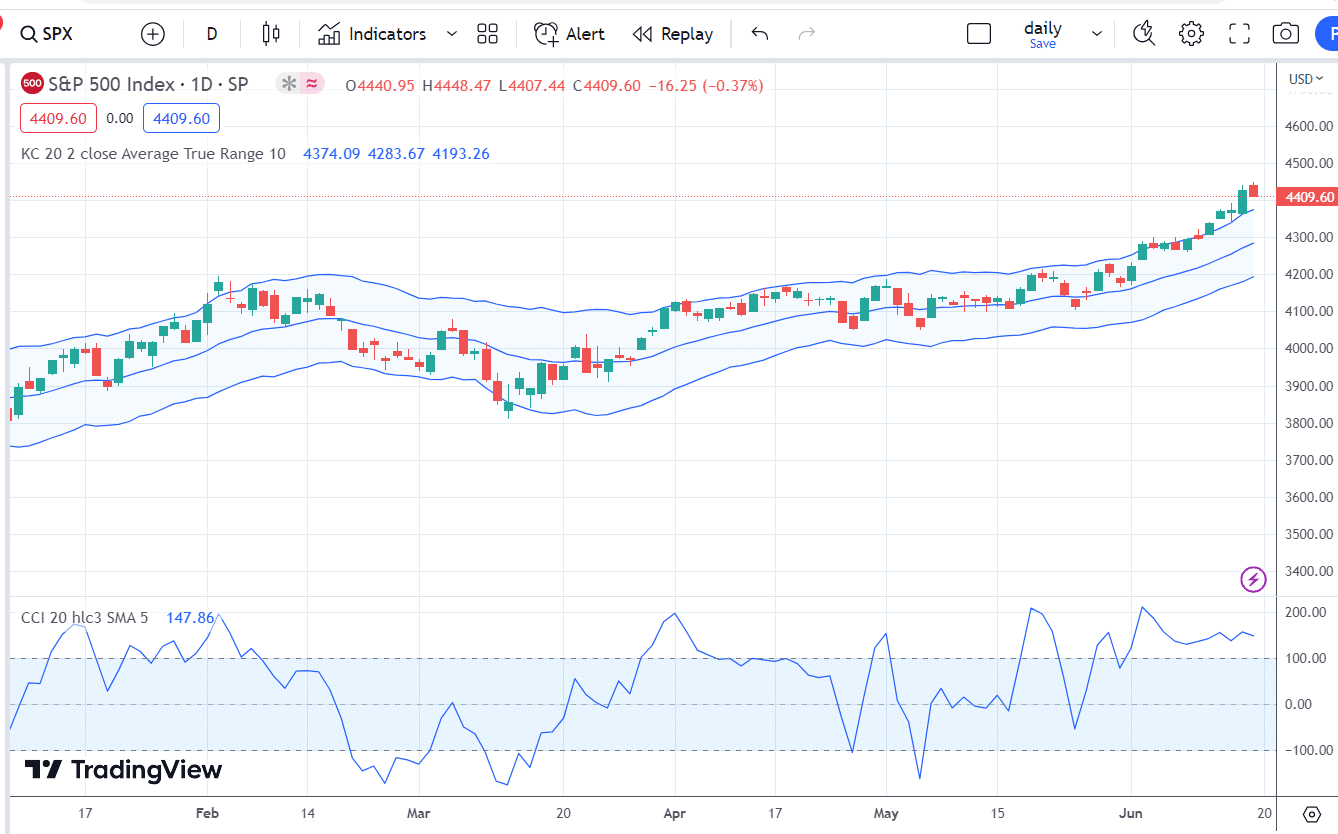
We see that Commodity Channel Index (CCI) is also showing overbought.
The price has gone outside of the Kelter Channel, whose bands are at two ATR (Average True Range).
VIX
Let’s look at the VIX, which is the volatility index of the SPX
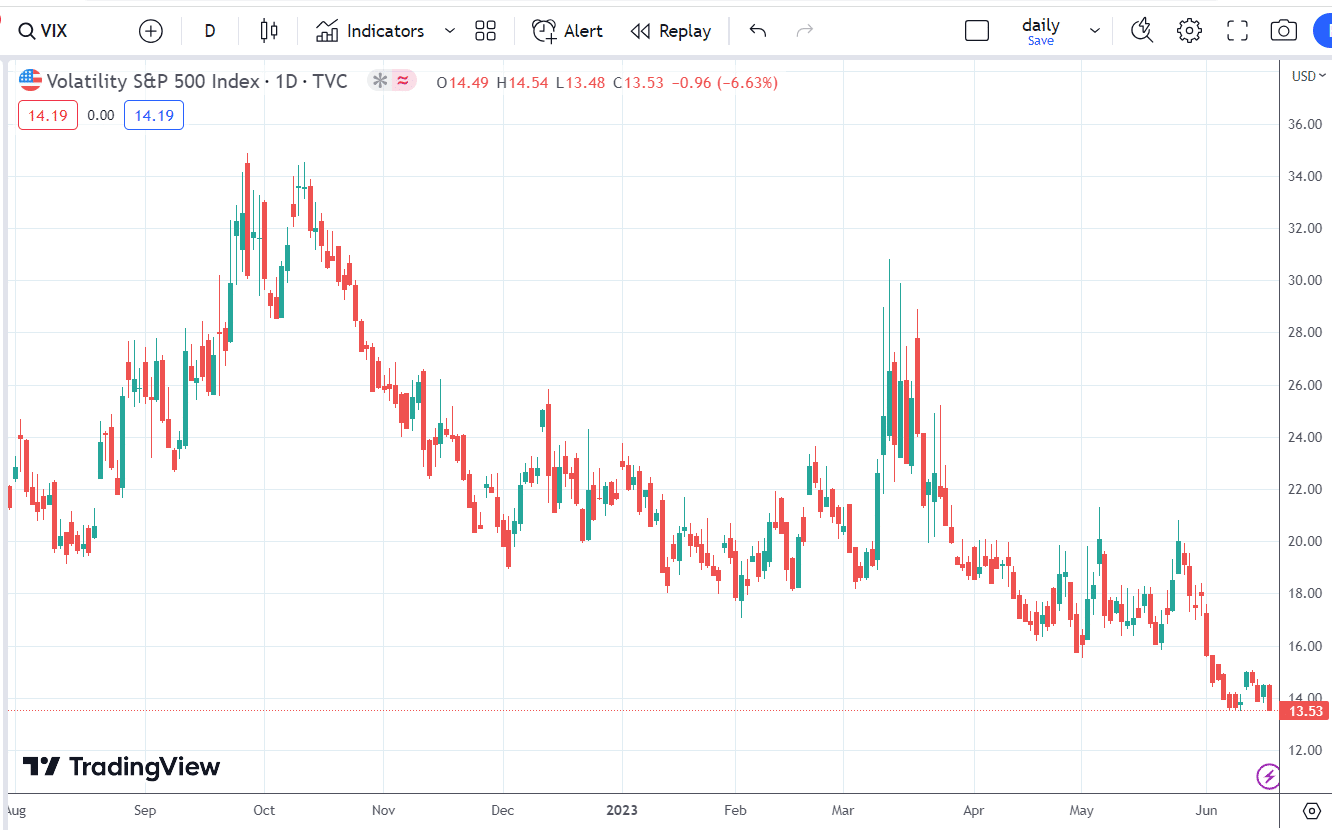
It is at 13.53, the lowest it has been since the February 2020 Covid pandemic crash.
So apparently, there is no fear in the market.
The VIX Futures Term Structure shows that the market is in strong contango.
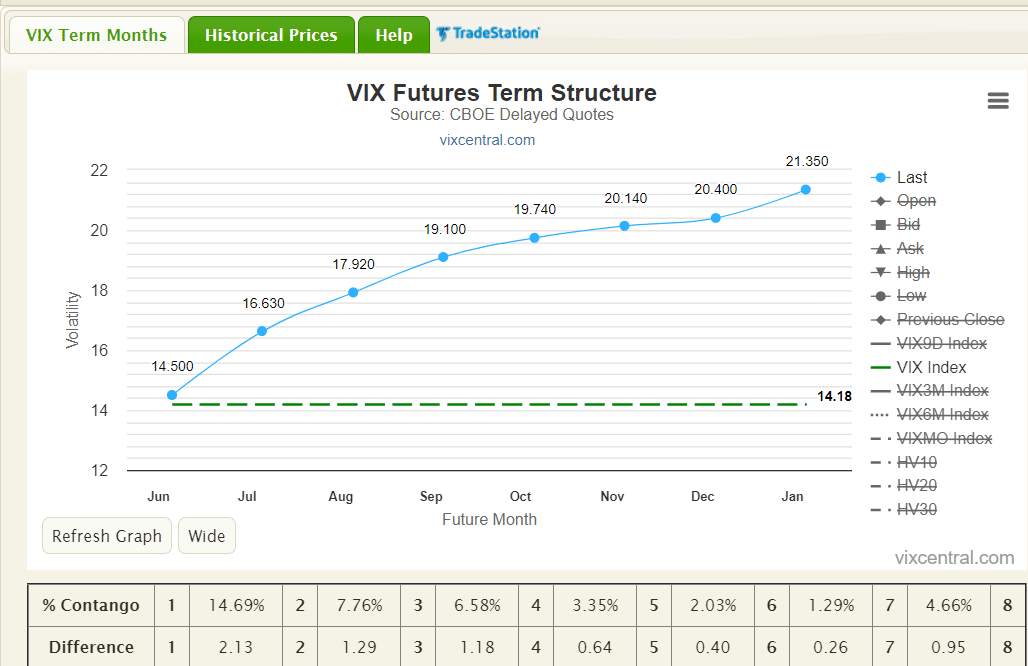
Contango between the first and second front months is 14.69%.
This means there is no fear, and the market appears healthy.
When the VIX Futures term structure shows backwardation, we have to worry.
But sometimes, this structure can switch very fast.
Conclusion
In conclusion, most indicators show the market price to be extended on the upside.
Some investors feel that we are due for a pull-back because of this.
The VIX and its term structure show the market to be healthy.
But who knows what tomorrow will bring?
By the time you read this, check the charts to see what happened afterward.
We hope you enjoyed this article on analyzing the market.
If you have any questions, please send an email or leave a comment below.
Trade safe!
Disclaimer: The information above is for educational purposes only and should not be treated as investment advice. The strategy presented would not be suitable for investors who are not familiar with exchange traded options. Any readers interested in this strategy should do their own research and seek advice from a licensed financial adviser.


