


Contents
Introduction
Have you ever watched a magic trick on social media and then played back the video really slowly to see how the trick was performed? Amy Meissner is the magician performing her magic with her A14 broken wing butterfly options strategy.
She did it again this year with great returns from her “favorite” and main “bread and butter” strategy.
I put those words in quotes because those were the words she used in a YouTube video just released in June 2023.
In that video, she announced her new Advanced A14 course published by the Aeromir Corporation, which would be the sequel to her original A14 course produced about 18 months earlier.
While it is not a requirement to take the first course before taking her advanced course, she does recommend doing so (which can be done by clicking on the “bundle package” option.
Even without having taken the course, it is possible to learn some basic concepts of trading non-directional broken-wing butterflies by looking at her two trade examples in the video – and playing them back in slow motion.
Trade Setup
The A14 is a put broken-wing-butterfly (BWB) with the long upper leg at the money and done on the SPX (S&P 500 index)
Let’s recreate the first trade example in our own Option Net Explorer backtesting software and turn back the calendar to October 15, 2021, which was when this trade example was initiated.
She mentions that this one was entered with two weeks till expiration.
We figured she was entering ten contracts on this trade (see FAQs).
We arrived at the strikes by looking at her risk graph.
Buy 10 October 29 SPX 4460 put @ $37.50
Sell 20 October 29 SPX 4420 put @ $25.75
Buy 10 October 29 SPX 4360 put @ $15.85
Net debit: -$1850
Max risk: $21,850
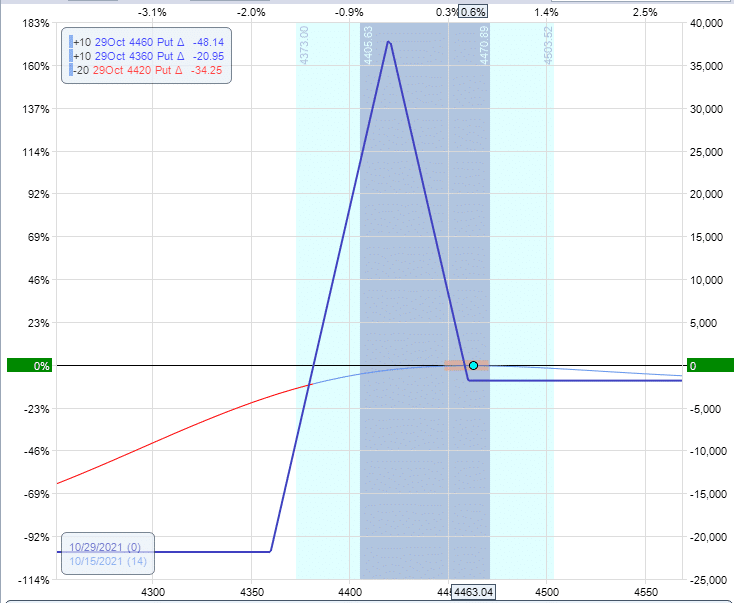
Our analytical software shows the Greeks to be:
Delta: -1
Theta: 197
Vega: -484
We can see in our example and her trade example that the delta is slightly negative, to begin with.
And we know these BWBs would be positive theta and negative vega trades (similar to the many income-style strategies such as the iron condor).
Adjustment
She made an adjustment to the trade on October 19 when SPX went up to 4515.
She added some upside calendars centered at what looks to be 4530.
This was what our OptionNet Explorer showed before the adjustment:
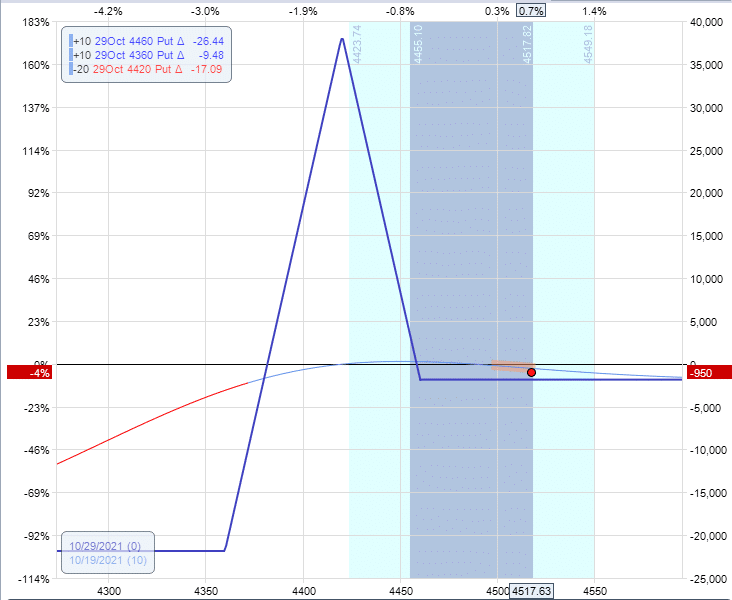
Delta: -17
Theta: 95
Vega: -90
Let’s add five calendars at 4530.
Sell 5 October 29 SPX 4530 call @ $23.60
Buy 5 November 5 SPX 4530 call @ $35.30
Net debit: 5 x -1170 = -$5850
Even though we had a 10-lot butterfly, we didn’t add ten calendars because we saw that the calendar expiration graph tent is smaller than a butterfly’s.
After the adjustment, it would look like this:
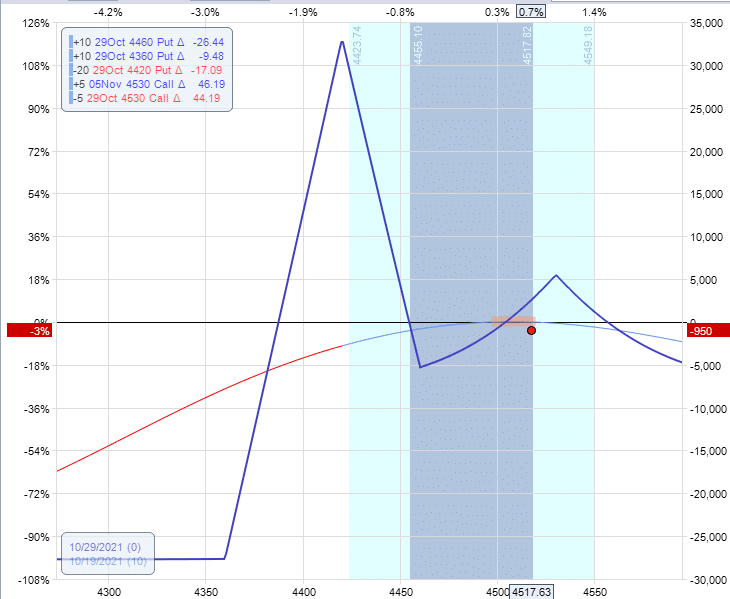
Delta: -7
Theta: 220
Vega: 370
The adjustment decreased the delta and increased the theta.
The vega switched from -90 to +370, which could be an issue if volatility dropped because calendars don’t like volatility dropping.
But if volatility dropped, that probably would have meant that SPX went up more toward the center of the calendar.
In that case, the calendar would have brought some profits from the delta.
If the price of SPX went down, the volatility might increase and expand the expiration graph of the calendar.
The calendar would lose on direction but make up for it with its long vega.
If the price were to sit still, it would be in the profit area of the calendar, and the calendar would profit from theta (the passage of time).
Note that the adjustment increases the risk in the trade to about $27,000.
Market Continues Up
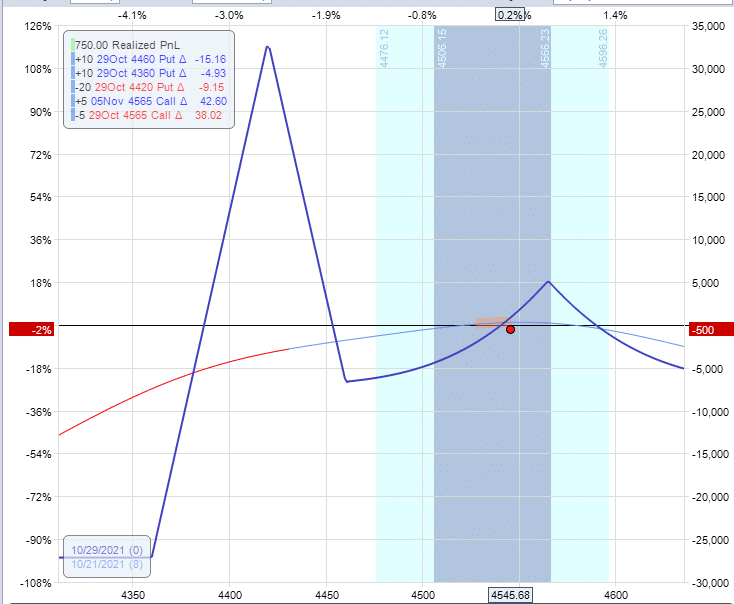
On October 21, the market continued to go up to 4545, and she rolled her calendars up to 4565.
Before adjustment:
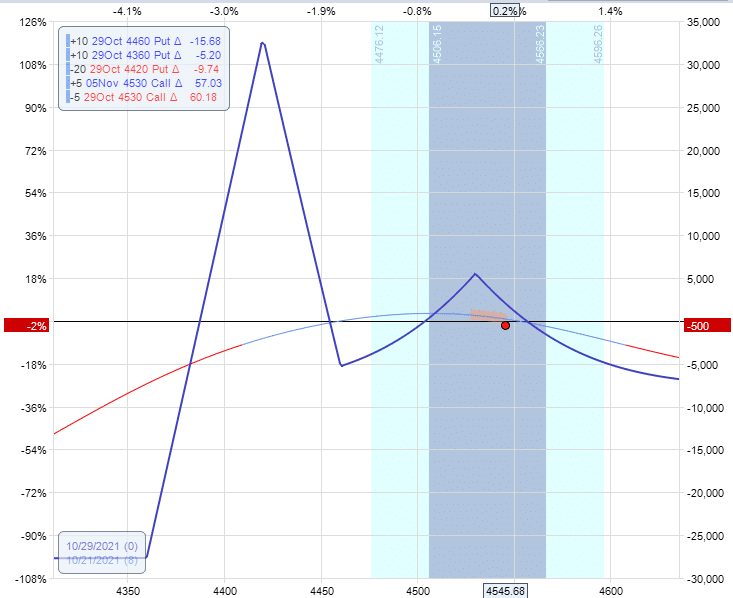
Buy to close 5 October 29 SPX 4530 put @ $34.05
Sell to close 5 November 5 SPX 4530 put @ $47.25
Sell to open 5 October 29 SPX 4565 put @ $15.05
Buy to open 5 November 5 SPX 4565 put @ $27.15
Net credit: $550
Note that we get a credit for rolling the calendars up.
We made money on the original calendars because we paid $5850 for them and sold them for $6600 when we rolled them up.
When we rolled them, we closed them and opened new ones.
The graph looks like this following that:
Closing Trade
On October 26, the market is now up 112 points from when we started.
At 4575, the SPX price is slightly above the center of the calendar.
She closes the trade at this time, saying that the profit target has been hit.
Her trade showed a profit of $1811, or 6.2% of the $2800 max margin used in the trade.
So her profit target is probably around 5% or 6%.
If you take a round number for easy memorization, then probably 5%.
Let’s see how it looks on our simulation in OptionNet Explorer on October 26:
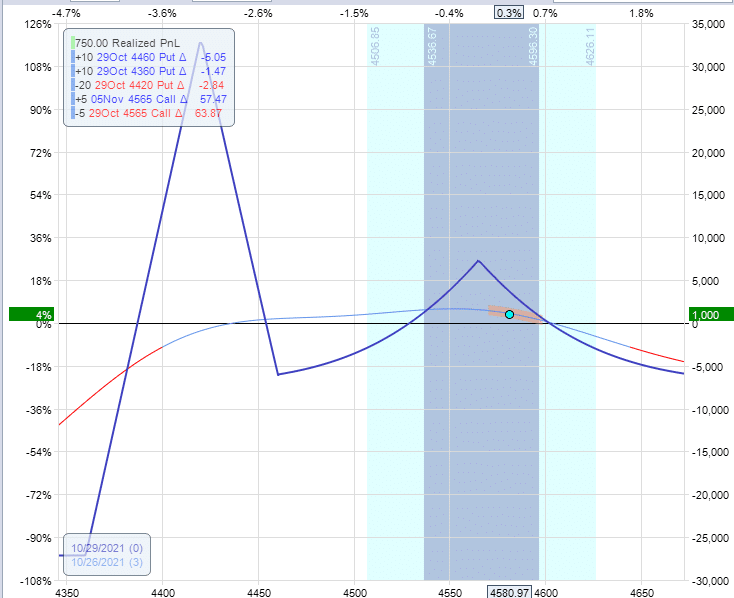
It is close.
It is showing a profit of $1000 on a max risk of $27,000, which is 3.7%.
While it is not at the profit target, we should close the trade anyways because she says she never takes the trade to expiration, and we only have three days left.
The average duration of these trades is about seven days.
The difference between her trade example and ours is due to the timing of the entries and adjustments.
Also, we didn’t know how many calendars she added, nor what was the time difference between the short and long legs of the calendar.
Downside Example
Her second trade example was one where the market moved down 100 points.
Based on the curvature of the risk graph, we know that some time spreads were used.
Then at a later point, the graph showed an upswing tail as the price goes down; this is likely a downside hedge such as a far out-of-the-money long put.
She did say that she could employ a “positive vega” hedge that would expand as the price goes lower. Both the time spread and long put would fit that description.
Conclusion
There are always a lot of individual choice decisions that come into play during adjustments, and the more experience that one has practicing the strategy, the better those decisions become.
And she has decades of trading experience.
It would be worthwhile to take her courses for anyone interested in the A14 trading style.
Certainly, they provide the exact rules and many more insights and examples that are beyond what we can share in this article.
FAQs
Where did the name A14 for this strategy come from?
The number 14 is the DTE (days to expiration) the trade has when it is started.
“A14” also corresponds to the Autobahn roadway number, where cars can go as fast as they want without speed limits.
How did you know that her first trade example was initiated on October 15, 2021?
The screenshot provided in the public YouTube video shows the trade risk graph in her analysis software showing a partial date of “10/15/2…”.
She said that this was the starting position of the strategy, and we can see that the price of SPX is at 4463.
The date could not have been 10/15/2022 because SPX was not at that price.
But on Friday, 10/15/2021, the price of 4463 was exactly within the range of the candle.
By looking at the risk graph, how can you tell where the strikes of the options are?
When there is a bend or angle in the expiration graph, there is an option with a strike at that price.
For example, the peak of the expiration graph is formed by the two short options of the broken-wing butterfly.
How did you know that her first trade example was using ten contracts?
The risk graph shows that her risk in the trade is $22,000.
A one-contract butterfly with those strikes shows a risk of $2185 when entered into OptionNet Explorer.
So her trade is ten times larger.
She must be doing ten contracts.
We hope you enjoyed this article on the a14 broken wing butterfly.
If you have any questions, please send an email or leave a comment below.
Trade safe!
Disclaimer: The information above is for educational purposes only and should not be treated as investment advice. The strategy presented would not be suitable for investors who are not familiar with exchange traded options. Any readers interested in this strategy should do their own research and seek advice from a licensed financial adviser.


Sell 5 October 29 SPX 4530 call @ $23.60
Buy 5 October 29 SPX 4530 call @ $35.30
Buy should be November 5
Indeed. That’s fixed now, thanks for letting me know.