


A demand zone is a price area where big institutional buying previously overwhelmed selling pressure, causing a sharp, impulsive move away from that level.
When this level is identified, traders can wait for the price to return to it.
There is a chance that the big institutions have unfilled orders they want to buy.
Other traders who missed the first impulsive move may also be waiting there for a second opportunity.
This creates a high probability for price bouncing from that area, making it an attractive entry point for options strategies.
Some people call this a support zone.
Either way, this can be a place of a good buying opportunity or the initiation of a bullish option trade.
It is important to note that this is not a line in the chart.
This is a price range.
Hence, we call it a zone.
This zone is typically defined by the consolidation candles that preceded a strong bullish impulse.
This consolidation is where big money is accumulating shares.
The sharper and cleaner the departure from the zone, the more likely it is to act as strong support when the price returns.
A slow, grinding departure suggests weaker institutional conviction and generally produces a less reliable zone.
From an options perspective, demand zones are useful because they give you a defined area to anchor risk management decisions around.
If the price closes cleanly below the zone, you have a clear invalidation point.
This makes it far easier to decide when to close a losing trade rather than holding indefinitely and hoping for recovery.
Contents
- How to Draw a Demand Zone
- Example of a Demand Zone
- Look in the Lower Timeframe for Confirmation of Reversal
- Fresh or Tested Zone
- When a Demand Zone Is Invalidated
- In Conclusion
How to Draw a Demand Zone
Drawing a demand zone correctly is one of the most practical skills a chart-based options trader can develop.
The process starts on a daily timeframe. Scan the chart for areas where price made a swift, explosive move upward after a period of sideways consolidation.
That consolidation area is your candidate zone.
To define the boundaries of the zone, use the bodies of the consolidation candles rather than their wicks.
The top of the zone is typically the high of the last consolidation candle before the impulsive move.
The bottom of the zone is the lowest candle body within the consolidation cluster.
Some traders prefer to use candle wicks to make the zone slightly wider, giving it more coverage. Either approach works as long as you are consistent.
The quality of the zone depends heavily on the move that follows the consolidation.
A strong, impulsive departure, ideally a series of large-bodied bullish candles with little to no overlap between them, suggests powerful institutional buying.
A weak, choppy departure is less convincing.
When comparing two candidate zones, always prefer the one that launched with greater force and velocity.
This is the single most reliable indicator of how much unfilled demand remains at that level.
It also helps to consider the broader trend.
A demand zone that forms within an established uptrend has much higher odds of holding than one that forms against a strong downtrend.
When the overall trend is bullish, institutions are more likely to defend their demand zones because they are already positioned for higher prices.
This trend alignment is one of the most important filters when selecting which zones to trade.
Example of a Demand Zone
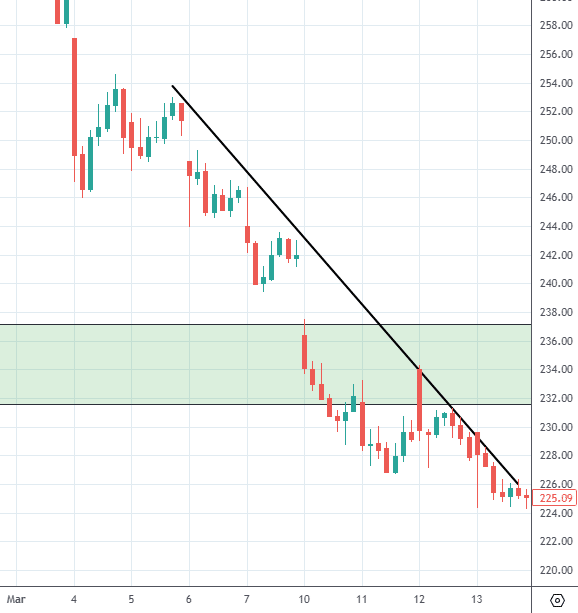
Here is a demand zone in the daily chart of PepsiCo (PEP)…
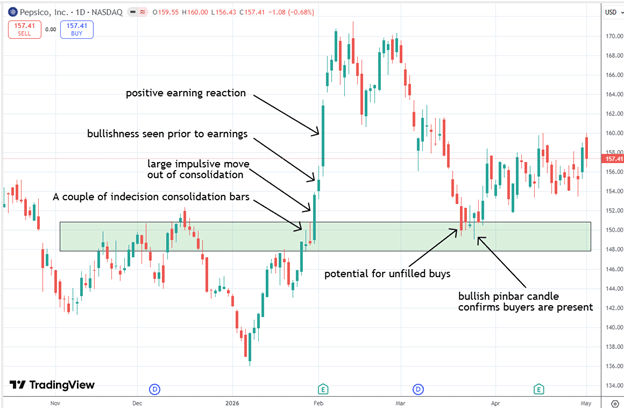
A trader could have initiated a bull put spread on March 26, 2026, the day after the bullish pinbar.
Or better yet, as soon as the price dips into the demand zone on March 20th, the trader can zoom into the lower timeframe of a one-hour chart to get confirmation of a trend reversal so as not to catch a falling knife.
On the one-hour chart, we do indeed see lots of evidence of a proper trend reversal…
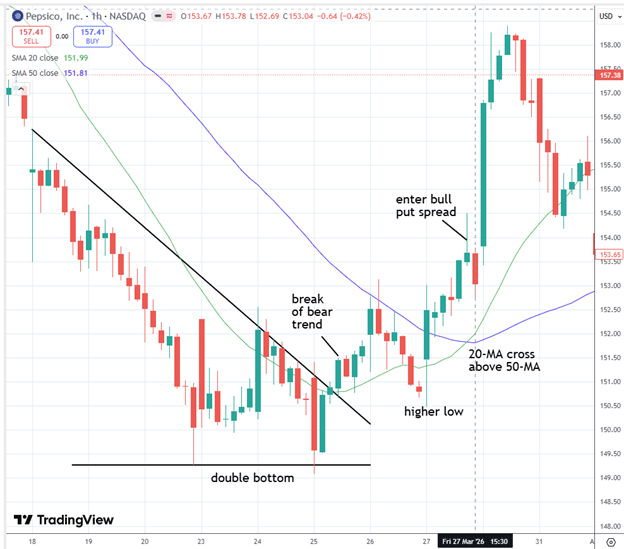
The price formed a double bottom and then broke above the bearish trend line, forming a higher low.
The 20-period moving average rounded the bottom and crossed above the 50-period moving average.
So a trader could now make a more precise entry at around 3 pm New York time on March 26.
Date: March 26, 2026
Price: PEP @ $151.35
Sell to open one contract, May 15 PEP $145 put
Buy to open one contract, May 15, PEP $140 put
Net credit: $111
Max risk: $389
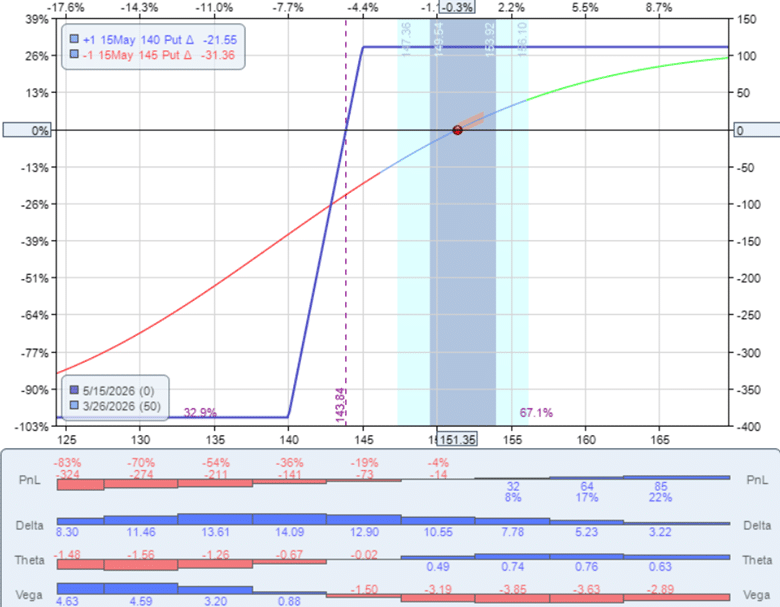
And three weeks later, on April 16, the trader can reap the profit of $68 per contract, or a 17% return on risk.
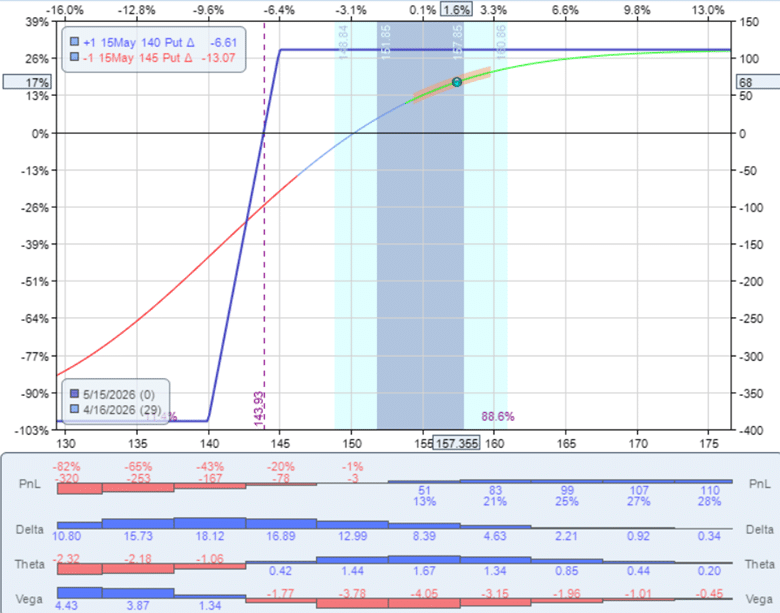
Notice how the demand zone created a natural floor for the short put strike at $145.
The zone gave the trader confidence to sell a put spread with the short strike below the zone’s lower boundary, keeping it out of the most likely range of price action during the trade.
This is the key benefit of using demand zones for defined risk strategies: the zone tells you where price is likely to hold, and you structure your trade around that expectation.
Look in the Lower Timeframe for Confirmation of Reversal
Below is a one-hour chart where the price simply fell right through the zone without any evidence of reversal.
So by looking into the lower timeframe for confirmation of a reversal pattern, it saved the trader from making a bad trade.
This is one of the most important habits a demand zone trader can develop.
The daily chart provides the context and the zone, but the lower timeframe provides the trigger. Without a trigger, trading blindly into a zone is little better than guessing.
Reversal signals to look for on the lower timeframe include: a bullish engulfing candle, a pinbar, a double bottom, or a break above a short-term downtrend line.
The more confluences that align, the higher the probability of a successful trade.
The lower-timeframe entry also improves your position sizing because you are entering with a tighter stop-loss relative to the expected move.
When using options, this tighter entry means you can often place your short put strike further below the zone, giving the trade more room to breathe while maintaining a favorable reward-to-risk ratio.
Fresh or Tested Zone
If the price has not revisited the demand zone yet, then the zone is fresh. Otherwise, it is a tested zone.
A trader can still trade off a tested zone. However, its reliability is lowered.
Fresh is better, as in the PepsiCo example.
Below we see a zone that was tested multiple times and is no longer fresh…
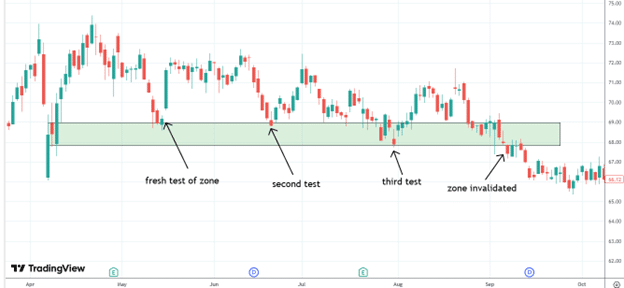
With each test, more and more buy orders are filled and absorbed until there are few buyers left, and the zone breaks.
Think of a fresh zone as a coiled spring: all the institutional demand is still sitting there, unmet.
A tested zone, by contrast, has already partially released that energy.
When evaluating whether to trade a tested zone, look at how the price reacted on each prior visit.
If the price bounced each time strongly, there may still be sufficient demand remaining.
If the bounces have been getting progressively weaker and shorter, that is a warning sign that the zone is being depleted and a break may be imminent.
From a high probability trading standpoint, you want to reserve your largest positions for fresh zones with the cleanest impulse departures.
Tested zones can still produce winning trades, but prudent capital requirements dictate that you reduce your exposure relative to a fresh, untested zone.
When a Demand Zone Is Invalidated
Price closing below the demand zone invalidates the zone.
Sometimes, big news that drives the market in one direction can cause even the best support zones to be broken.
A trader can also remove a zone if it has not been revisited for a long time or has been tested too many times.
When trading options in a demand zone context, knowing when a zone is invalidated is just as important as knowing how to enter.
Once the zone breaks, the dynamics reverse: the same level that was previously support can flip and act as resistance.
This is worth monitoring, as a broken demand zone can now become an area for bearish trades.
The key principle is that a daily candle closing clearly below the zone’s lower boundary is the clearest and most objective invalidation signal.
Intraday wicks below the zone are less conclusive and should not be treated as full invalidation on their own.
This clear invalidation rule also ties directly into risk management in options trading.
If you are holding a bull put spread and the zone breaks on a daily close, that is your cue to exit the position and take the loss rather than wait for expiration and absorb the maximum loss.
Managing exits actively is what separates disciplined traders from those who turn small losses into large ones.
In Conclusion
Identifying demand zones where price can bounce can make for good bullish options trades.
But not all demand zones are equal.
An experienced trader with extensive screen time can assess the quality of a demand zone by judging the impulse departure speed, volume, zone width, consolidation duration, trend alignment, multi-timeframe analysis, and other confluences.
One way to practice is to roll back time in the chart using the TradingView Replay feature, where you cannot see the future candles.
You can then step through day by day to identify the demand zone and see whether it worked out.
Mastering this skill takes time, but the payoff is a systematic edge in identifying high-probability entry points for bullish strategies such as bull put spreads, long calls, and even covered calls on stocks you are long.
When combined with sound position sizing and clear invalidation rules, demand zone trading can be a reliable and repeatable method for options traders at all experience levels.
The beauty of using demand zones for options is that they give you a structural edge that pure options theory cannot provide on its own.
Implied volatility, delta, and theta tell you about the pricing and timing of your options.
The demand zone tells you where the market is most likely to find buyers. When both sets of information align, you have a genuinely high-quality setup.
The bull put spread used in the PepsiCo example is particularly well-suited to this approach because it is a defined-risk strategy that profits as long as the price stays above the short strike at expiration.
With the demand zone acting as your structural support, you have an objective, chart-based reason to believe price will hold above that level, which is exactly the kind of conviction that makes an options position manageable and consistent over time.
A common question traders ask is how far below the zone to place their short put strike. There is no universal answer, but a practical guideline is to place the short strike at or just below the lower boundary of the demand zone.
This positions the short strike at the very level where institutional buying is most likely to defend the price.
If the zone is relatively narrow and clearly defined, the short strike can sit right at the zone’s base.
If the zone is wider or slightly less defined, adding an extra buffer of five to ten dollars below the lower boundary can provide additional comfort, at the cost of slightly lower credit.
Your choice will ultimately depend on your assessment of the zone’s quality, your risk tolerance, and how much credit you need to make the trade worthwhile relative to the required margin.
We hope you enjoyed this article on demand zones for options.
If you have any questions, send an email or leave a comment below.
Trade safe!
Disclaimer: The information above is for educational purposes only and should not be treated as investment advice. The strategy presented would not be suitable for investors who are not familiar with exchange traded options. Any readers interested in this strategy should do their own research and seek advice from a licensed financial adviser.


