


While true volume profile traders have much more sophisticated tools, for this introductory article, I want to show free tools.
I will be using the “Fixed Range Volume Profile” tool in TradingView.
You might need to register a TradingView account, but at least this is a free feature.
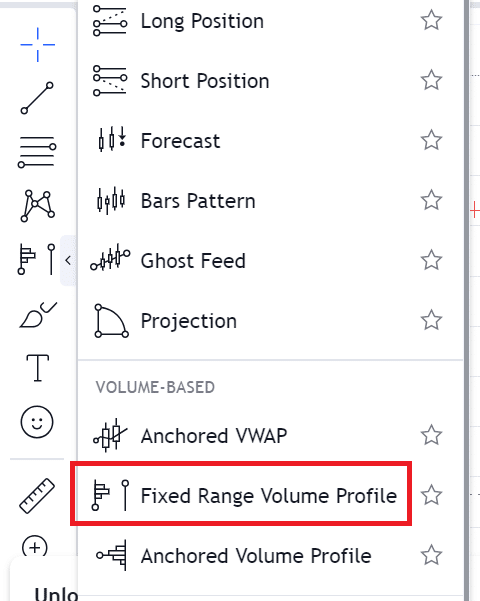
This is simply from the “Tools” menu.
TradingView does have the more sophisticated “Session volume profile” in its indicators menu.
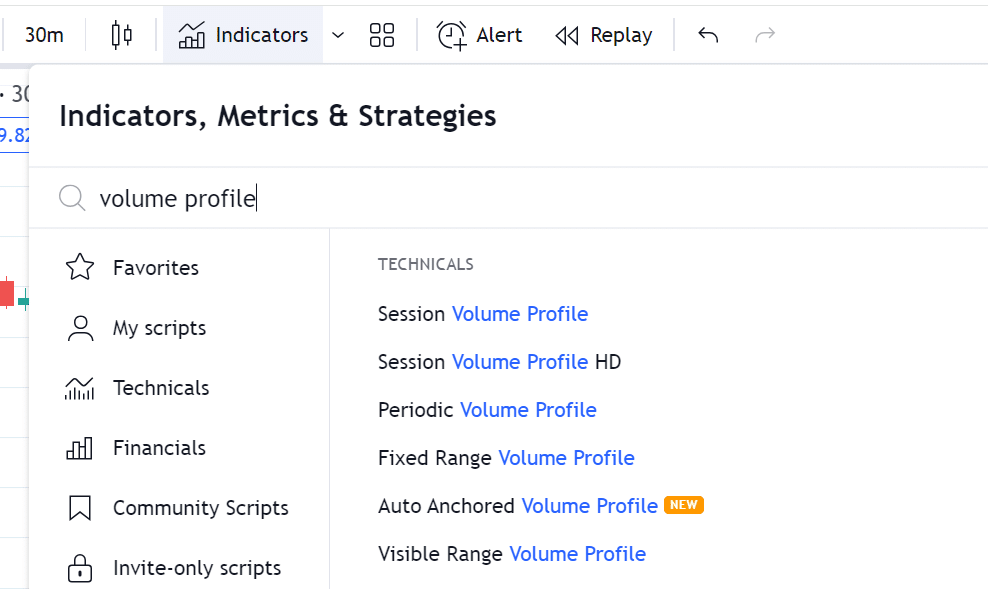
But that is a paid feature.
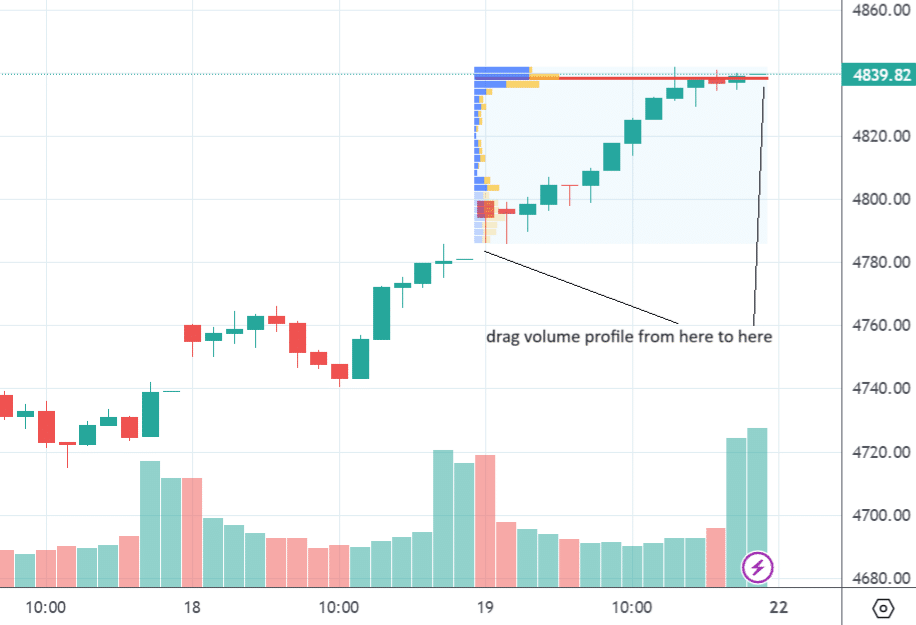
In the screenshot below, I brought up a 30-minute candlestick chart of SPX in TradingView and then dragged the volume profile tool from the start of the trading day of January 19th to the end of the trading day.
Why a 30-minute chart?
Traditionally, the market profile TPO time block length is 30 minutes for intraday charts, where each letter represents 30 minutes of trading for that particular asset.
TPO is “time price and opportunity” in market profiling.
Market profiling is calculated differently from volume profiling but has a lot of similarities.
Remember that market profiling has letters in the histogram, and volume profiling does not.
Today, we are only talking about the volume profile.
The volume profile shows the volume of orders based on a particular asset price.
This differs from the common volume histogram at the bottom of your chart, which is the volume of orders based on a particular time.
In the above, you see a red line in the profile at the 4839 price level.
This is known as the point of control (POC).
It says that is the price level that is most heavily traded during the profile range, which in our example is the trading day of January 19th.
You can think of the volume profile histogram as the result of a popularity contest.
The lengthier the bars, the more popular the price.
The 4839 price (indicated by the POC) is the most popular price of the trading day.
In our profile example, this POC occurs very near the top of the trading day’s high.
To those who study market profiling, this may mean a greater chance of one thing happening versus another thing happening.
Looking more closely at the screenshot below, we have what is called high volume nodes (HVN).
The POC is the highest volume node.
It has the longest histogram bar.
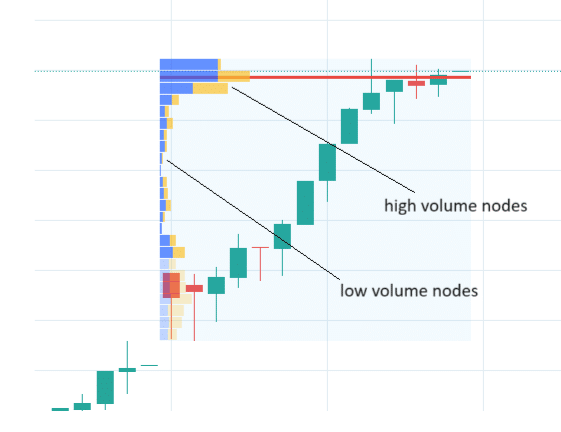
Then, there are low-volume nodes (LVN) where fewer orders are traded at that price.
The “value area” on the profile is where about 70% of the orders are traded.
We can see the value area better in another example profile:
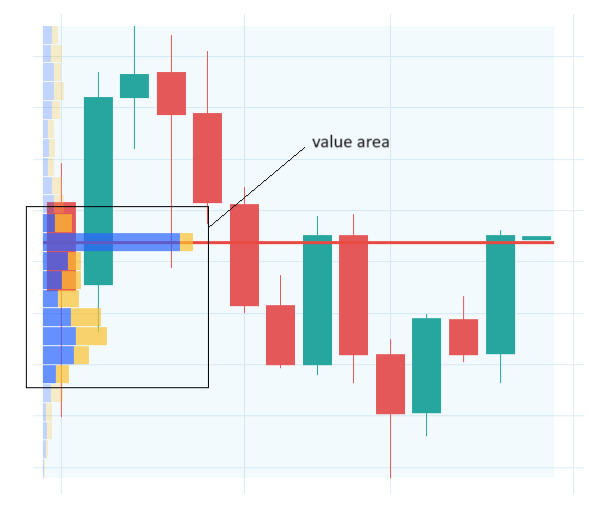
The value area is indicated in TradingView by brighter color on the histogram.
The non-value area histogram bars are dimmed.
For statisticians, the value area represents about one standard deviation of all the orders.
In a normal distribution, 68% of the data falls within one standard deviation of the mean.
For traders, we just say 70% is close enough.
What Is The Virgin Point Of Control?
Below, I have drawn the volume profile for the last five trading days.
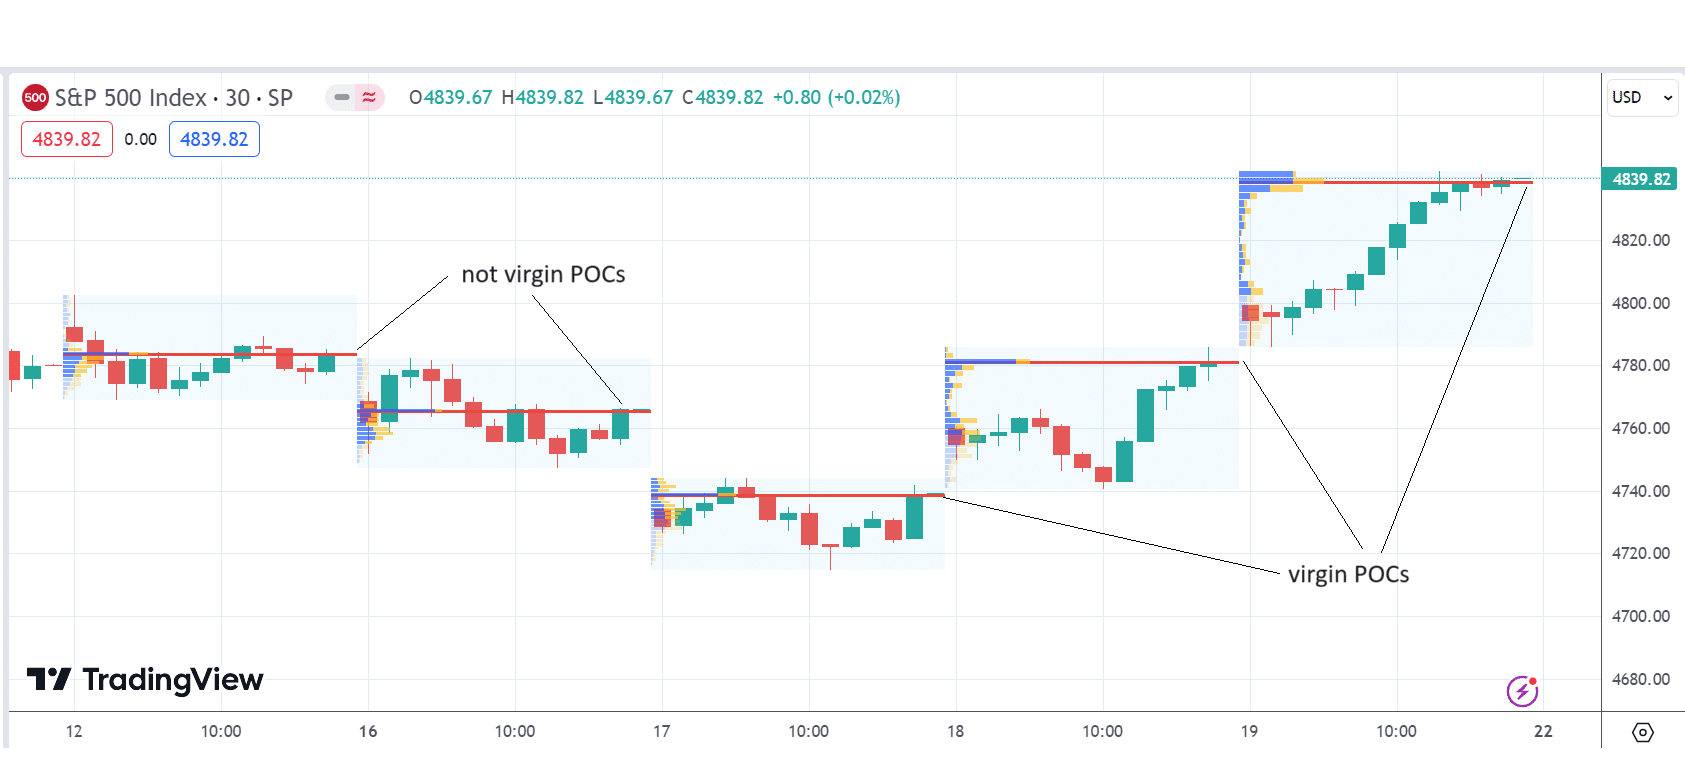
In this free tool, I had to manually draw the profile for each day.
You would not have to do this if you were using a more sophisticated tool.
See if you can figure out why the last three POCs are known as virgin POCs, whereas the other two are not.
The virgin point of control is a point of control that has not yet been touched.
It is also known as the naked point of control.
It is naked because no candlesticks have covered it.
The POC of January 17th is at the 4739 price level.
Since then, the market has not returned to the 4739 price level yet.
Hence, this POC is a virgin point.
Similarly, the POC of January 18th at 4781 had not been traversed by any candlesticks since then.
The last profile POC is always a virgin POC at the time the profile ends.
The POC of January 12th and 16th are not virgin because those price levels had been touched again by the trading session of January 18th.
The trading session of January 18th had traded through the POC price of January 12th and 16th.
Conclusion
While the market profile differs from the volume profile, many profile traders use both.
More sophisticated software often will display both of them at the same time.
The terminology of the two is the same; they both have a point of control, value area, and high and low-volume nodes.
Now you know how to speak the terminology of these profile traders.
If you need to speak fast, just say “POC” (pronounced “P-O-C”) or say “vPOC” (pronounced “V-poc”). They will know what you mean.
We hope you enjoyed this article on volume profile.
If you have any questions, please send an email or leave a comment below.
Trade safe!
Disclaimer: The information above is for educational purposes only and should not be treated as investment advice. The strategy presented would not be suitable for investors who are not familiar with exchange traded options. Any readers interested in this strategy should do their own research and seek advice from a licensed financial adviser.


