


The MACD indicator has a lot of moving parts.
Today, we are only looking at what happens when the MACD line approaches zero.
Contents
Introduction
Focus only on the MACD line in the bottom panel – the black line.
Completely ignore the MACD red signal line and its histogram.
With its default settings, the MACD indicator is based on the stock’s 12-period exponential moving average and the 26-period exponential moving average.
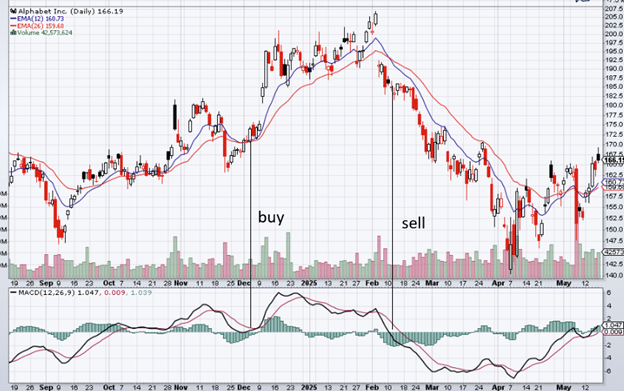
I have the 12-EMA shown in blue on the candlestick chart.
And the 26-EMA in red.
If the 12-EMA is above the 26-EMA, the MACD value is positive – the black line on the indicator panel is above the zero-value horizontal.
If the 12-EMA is below the 26-EMA, the MACD value is negative – the black line is below the zero-value horizontal.
The interesting part to watch is when the MACD value approaches zero.
This happens when the 12-EMA and the 26-EMA touch.
Does the MACD line decisively cross the zero-value horizontal as in the case of Feb 10th in the above chart?
Or does it bounce off the zero-value horizontal as it did in December?
In the case of February, a trader taking a bearish trade when he sees the MACD line decisively cross zero from above would have made good profits, as can be seen from the chart.
When the MACD line crosses zero like that, it means that the 12-EMA just crossed below the 26-EMA on the candlestick chart.
And that is a bearish crossover signal.
In the case of December, a trader taking a bullish trade when she sees that the MACD line bounces off the zero-value horizontal from above would have made good profits, as can be seen from the chart.
When the MACD line coming from above refuses to cross zero, it means that 12-EMA has pulled back to the 26-EMA but does not cross the 26-EMA.
This is a bullish pullback trade in an uptrend.
It is an uptrend as defined by the 12-EMA being above the 26-EMA.
It remains in an uptrend as the 12-EMA and the 26-EMA kiss but does not cross.
We turned on the moving averages to show you the relationship between the MACD value and the moving averages.
A trader skilled at reading MACD would not even need to have the moving average turned on.
Because what the MACD does already indicates what the moving averages are doing.
MACD Replaces The Moving Averages
Here is another chart with the moving averages turned off:
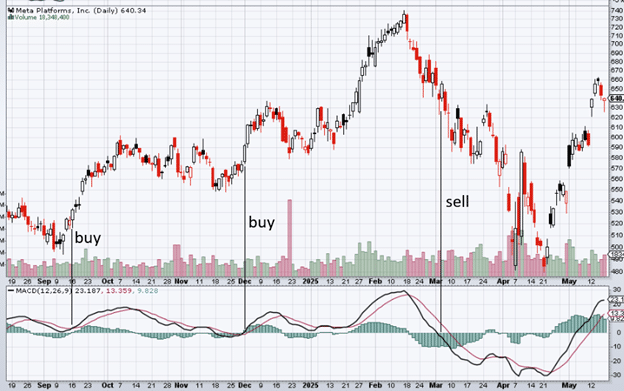
Look what would have happened if the trader initiated a bullish trade in September, a bullish trade in December, and a bearish trade in March.
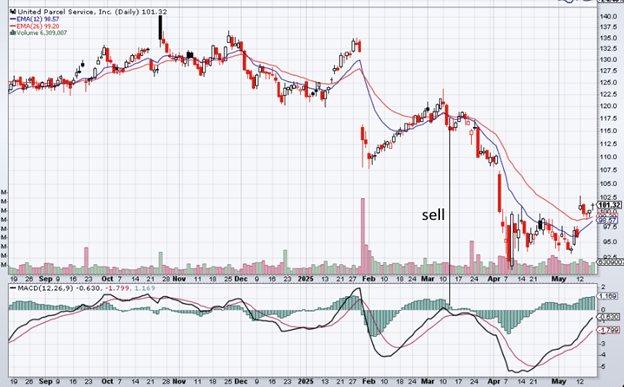
The above examples were MACD lines approaching zero from above.
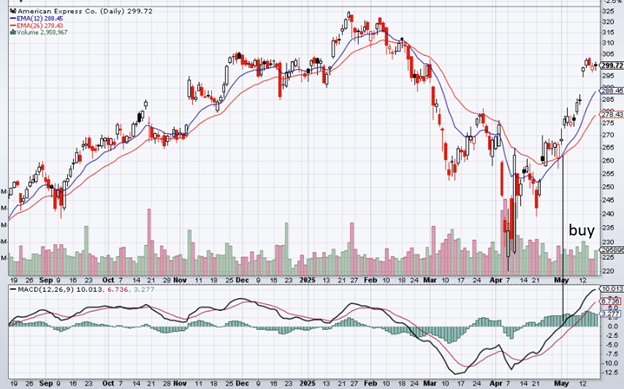
MACD Coming From Below
Now we show examples where MACD lines approach zero from below:
Conclusion
If this article has shown you something about MACD that you have never seen before…
If this article has given you potential new trade signal ideas.
If this article has given you a better understanding of how the MACD line and the moving averages are related.
If this article has given you new respect for the MACD indicator.
Then this article has done its job.
We hope you enjoyed this article on what happens when the MACD approaches zero.
If you have any questions, send an email or leave a comment below.
Trade safe!
Disclaimer: The information above is for educational purposes only and should not be treated as investment advice. The strategy presented would not be suitable for investors who are not familiar with exchange traded options. Any readers interested in this strategy should do their own research and seek advice from a licensed financial adviser.


