


The M3.4u options strategy is a slightly bullish bias income generating strategy using the broken-wing butterfly.
Its creator John Locke says it is one of his favorite trades.
Apparently, it is his viewer’s favorite as well.
Because this strategy just won the viewer choice “Winning Trade of the Year” award two years in a row for 2021 and 2022.
Contents
Introduction
In episode 98 of his “Winning Trade” YouTube videos, we see that his viewers like the M3.4u over his other contending strategies, such as the M3, the ROCK, the X4v22, the Bearish Butterfly, and the Dynamic Bear Trade.
They liked the strategy’s consistency of wins while still holding decent (although not the highest) returns.
You can get a sense of its dependability (which is why this trade is nicknamed “the Dependable M3.4u”) by seeing the paper trading results spreadsheet in one of his videos:
January 2020: 2.6%
February 2020: 9.3%
March 2020: -8.6%
April 2020: -12.4%
May 2020: 8.8%
June 2020: 6.9%
July 2020: 16.9%
August 2020: 18.5%
September 2020: 13.6%
October 2020: 9.4%
November 2020: 8.1%
December 2020: 2.0%
January 2021: 4.3%
February 2021: 4.1%
March 2021: 12.7%
April 2021: 19.5%
These percentages are based on returns on a planned capital of $5000.
The disclaimer on the spreadsheet says:
“This page represents the results from the “real-time” simulated positions of the “base level rule-based version” of the M3.4u trade as outlined in the “rule-based portion” of the M3.4u Program. These results are shared as an example for educational purposes ONLY, it does not imply that the information stated is accurate nor that it is possible. Trades are “real-time” simulated trades. Simulated trades are believed to be represented as accurately as possible; however, live results may have been different.”
Nevertheless, the paper results showed that it had a twelve-month winning streak after the two months of losses during the Coronavirus period of 2020.
I took out my calculator (umm, my spreadsheet) and averaged the percentages of those 16 months.
And it averaged 7.2% a month.
However, if you look at the price chart of RUT, those months were mostly bullish months, and this is a slightly bullish-biased strategy.
I want to know how it would do in a bearish year like 2022.
The Rules For The M3.4u
While you can buy his course on the M3.4u, he doesn’t keep the rules a big secret.
And I don’t think he minds if you know the rules of the strategy.
If you watch all his Episodes 96, 91, 88, 79, 67, 64, 54, 42, 37, 29, 17, and 04, on his public YouTube videos, you will be able to piece together the full rule set for the M3.4u strategy.
The rules are relatively simple and non-subjective compared to other strategies.
There is not much room for trader decisions in this strategy (except perhaps near expiration deciding whether to exit or let expire).
The trade starts with a two-lot broken-wing butterfly on the RUT index with the short strikes 20 points below the current price.
The upper wing is 40 points wide, and the lower wing is 60 points wide.
The delta limits should be between -3 delta to +4 delta for the two-lot position.
If the initial butterfly position is not within delta limits, you need to change the upper wing to 50 points wide and check again.
Recently, the volatility of the RUT (which can be tracked by the RVX index) is such that this 50/60 wider butterfly needed to be used.
Here is a typical example butterfly that would be initiated on December 23, 2022, for the February 17, 2023 expiration that is exactly 56 days away.
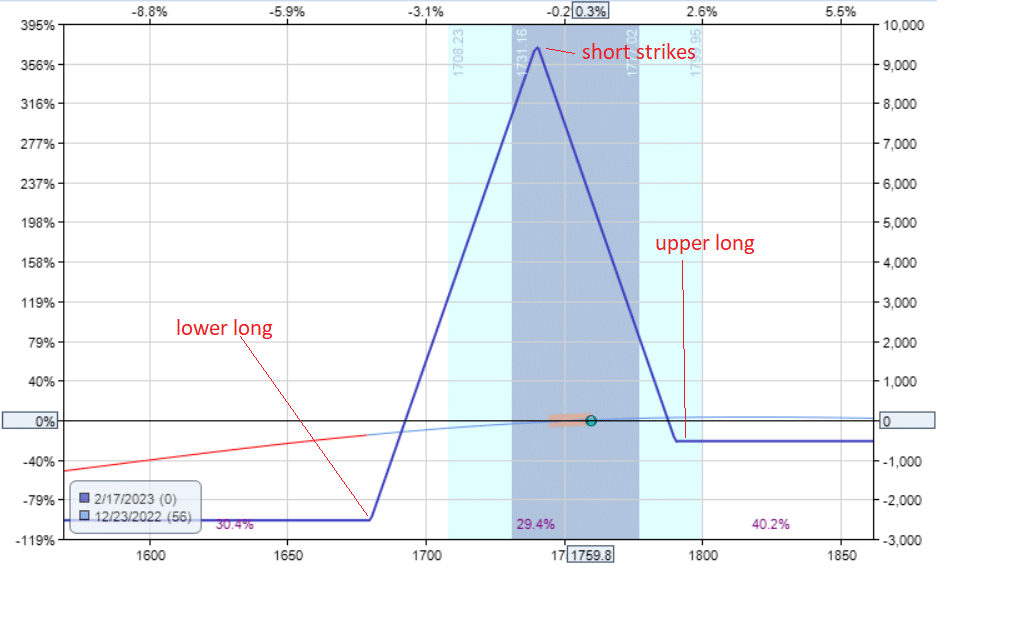
source: OptionNet Explorer
The maximum theoretical risk on the trade is slightly above $2500.
The trade is checked once a day.
If the delta limits are exceeded, the long upper leg is moved up or down one or two strikes to get the delta back in line.
As you make this change, the maximum risk of the trade changes.
If the capital at risk exceeds $4000, roll the lower leg until the max risk is less than $4000.
This adjustment also has the effect of removing capital from the trade.
If the price is above the long upper strike, the delta limits change from (-3 to +4) to (0 to +4). In other words, we don’t want any negative delta outside of the tent on the upside.
If there is, performing a reverse Harvey adjustment will usually bring it back in line.
If at any point you end up with a symmetrical butterfly and delta are not within limits, you have to roll the entire position down and configure it as starting position.
At any point, if the P&L loss is greater than $500 (which is 10% of planned capital), you exit the trade.
Otherwise, run the trade to expiration or very close to expiration.
There is no particular profit target. We take whatever the market can give us.
FAQs
Why is the trade named M3.4u?
It is because it was based on John Locke’s M3 delta-neutral butterfly strategy.
The “4u” is the particular version or variation offshoot of that strategy.
Whereas the M3 had an extra call option with the butterfly, the M3.4u does not have the call option.
This reduces the capital requirements of the M3.4u.
The M3.4u tends to do better than the M3 in an up-roaring market.
In contrast, the M3 does better in choppy markets.
The M3.4u does not roll the structure upward and has less rolling overall.
So it is simpler to manage than the M3.
What is John Locke’s background?
John started as an auto mechanic and then became a top options trader on a professional trading desk of SMB Capital.
He found that he liked helping people and went into the life coaching business and established Locke In Your Success, LLC in 2006.
There he helps people in life as a success coach and in trading.
Options trading is most likely how most traders come to know John because he created many income-style trading strategies.
Not only does he coach these strategies, but he also coaches trading psychology.
Because interestingly, he holds certifications in the psychological areas of NLP (Neuro-Linguistic Programming) and hypnosis, including Ericksonian Hypnotherapy.
What is the difference between the return on planned capital and the return on risk?
Planned capital is the amount of money set aside for the trade to account for margin changes and have cash available to make the adjustment.
The trade typically has a max risk of around $2500 per trade.
But $5000 of planned capital is placed aside.
As adjustments are made to the trade, the maximum margin required changes.
The maximum margin required in a trade is the maximum risk of the trade or the maximum capital at risk.
Since not all trade uses the entire planned capital, the return on planned capital is a more conservative calculation.
The return percentages would be higher if you computed based on returns on the maximum margin used.
The return on planned capital is more true to what a portfolio would return, whereas the return on max risk is what a particular trade might return.
How is the M3.4u different from the A14 Weekly Options strategy?
While on the surface, the M3.4u looks like Amy Meissner’s A14 butterfly strategy.
They are not the same.
The two strategies are both non-directional broken-wing butterflies with 40 points upper wings and 60 points lower wings.
These are not similarly sized butterflies.
This is because the M3.4u is traded on the RUT, and the A14 is traded on the SPX, which is about twice as big as the RUT.
Relative to the size of its underlying index, the A14 is a much narrower butterfly.
This makes sense because the A14 starts with 14 days to expiration, while the M3.4u starts at 56 days to expiration.
The range of price movement in 56 is larger than that of 14 days; hence, a wider M3.4u butterfly is needed.
The A14 never holds to expiration.
The M3.4u is intended to hold to expiration.
The A14 adds structures and time spreads.
The M3.4u never adds structure and never has time spreads.
Nope, they are not the same and don’t trade the same.
But interestingly, both John and Amy check their strategy once a day (usually near market close).
It is as if they intentionally don’t want to look at the trade during intraday swings.
Conclusion
Is the M3.4u right for you?
Don’t know.
I don’t know your trading style.
I recommend running a manual backtest of the strategy using software with historical pricing data (such as OptionNet Explorer).
You will get a feel for the rules and if you like trading this style even if you do like it.
It is good to perform this backtest with your own hands and to see the results with your own eyes.
This is the best way to gain confidence in the rules of a rule-based strategy.
Because if you don’t have full confidence in the rules, you might override the rules and hence not get the same results.
For example, you might see a big red candle and abort the trade, locking in a loss when the rules did not tell you to get out.
Or you might take a smaller profit (which would not be enough to cover your losses) to avoid a news event, etc.
Make it a rule to backtest any new strategy before deploying it live.
This might be a good rule.
We hope you enjoyed this article on the m3.4u options strategy.
If you have any questions, please send an email or leave a comment below.
Trade safe!
Disclaimer: The information above is for educational purposes only and should not be treated as investment advice. The strategy presented would not be suitable for investors who are not familiar with exchange traded options. Any readers interested in this strategy should do their own research and seek advice from a licensed financial adviser.


Really great strategy review!
Thanks Steve.
I will say backtesting on TOS OnDemand is rough!!!
How so Steve?
Hi Gavin. Thanks for the detailed breakdown. I have a question regarding “The delta limits should be between -3 delta to +4 delta for the two-lot position.” – What does it mean? 🙂 Is it “Sum of all deltas on BWBF (e.g. -0.49×1 + 0.48×2 – 0.46×1 = 0.01 ) should be between -0.03 and +0.04 ?
Yes that’s right. We just say -3 and 4 delta for short, rather then -0.3 and 0.04
Thanks for the nice summary!
“the delta limits change from (-3 to +4) to (0 to +4). ” are the deltas for 1-2-1 sized tranches?
yes