







If you have never viewed your price charts using a logarithmic scale, you should – at least in certain scenarios.
It is true that the default linear scale looks the same as the logarithmic scale if you are looking at the daily chart over a short time span.
It is when viewed at a longer time scale that it makes a difference.
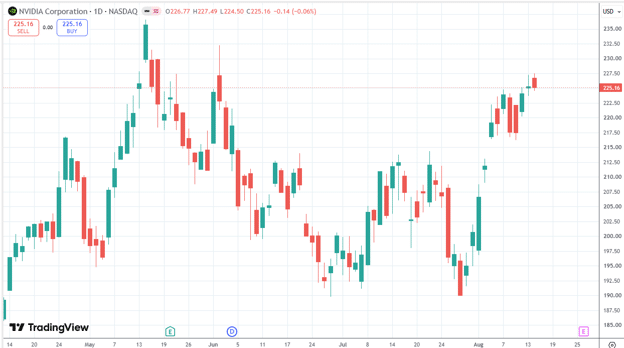
Here is a “normal” (linear) price chart of Nvidia (NVDA) over the past four months, with each candle representing a single trading day:
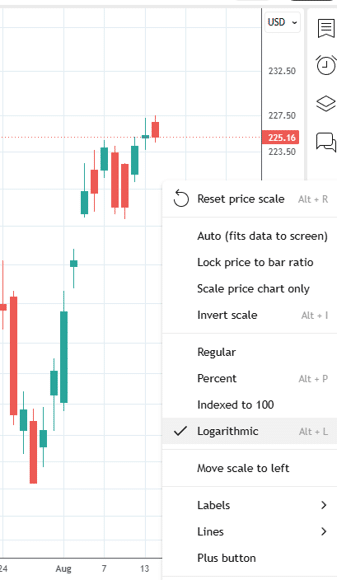
If you were to right-click on the price axis and select “Logarithmic”
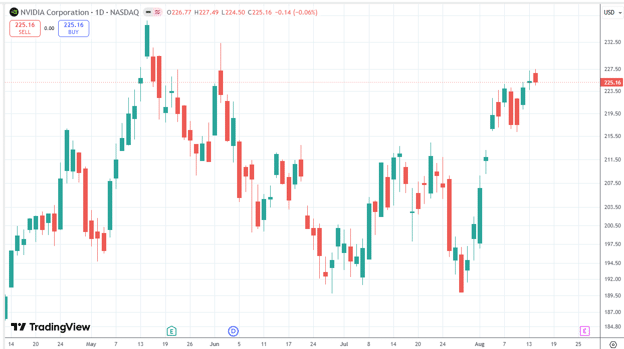
It would look pretty much the same…
Contents
- Over Longer Timeframes
- Linear Vs. Logarithmic Price Scales
- Why This Matters Over Long Periods
- Strategy Equity Curves
- Are Prices Accurate On A Logarithmic Scale?
- Trendlines Are Often More Meaningful On A Log Chart
- Why Options Traders Should Care About Log Scale
- FAQ
- Conclusion
Over Longer Timeframes
Now, consider a weekly chart covering a four-year span.
On a linear scale, it might appear that 2024 was the strongest year of the period.
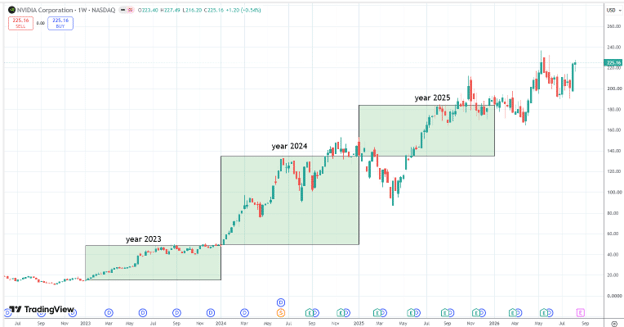
However, using a logarithmic scale provides a more accurate representation, revealing that 2023 actually outperformed 2024 in terms of growth.
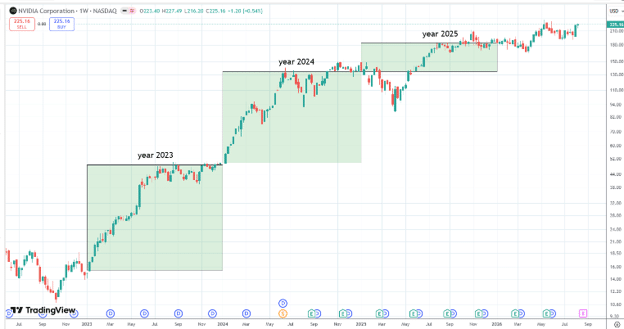
Looking at the split-adjusted share prices:
Year 2023: Opened at $14.85, ended at $49.52 (a $34.67 or 233% gain).
Year 2024: Opened at $49.24, ended at $144.47 (a $95.23 or 193% gain).
Although 2024 saw a larger nominal dollar increase as represented by the linear chart, it is 2023 that achieved a higher percentage gain as represented by the logarithmic chart.
This highlights the core difference: linear charts measure price changes in absolute dollars, while logarithmic charts measure them in percentages.
Linear Vs. Logarithmic Price Scales
On a traditional linear chart, the vertical axis is divided into equal dollar increments.
For example:
$20
$30
$40
$50
$60
Each step represents exactly $10.
Therefore, a move from $20 to $30 occupies the same vertical space as a move from $100 to $110, even though the former is a 50% gain and the latter is only 10%.
But from an investor’s perspective, those two moves are very different.
A move from $20 to $30 is a 50% gain.
A move from $100 to $110 is only a 10% gain.
A logarithmic chart accounts for this by spacing prices based on percentage changes rather than absolute dollar values.
Why This Matters Over Long Periods
Consider a stock rising from $10 to $100 – a tenfold, or 900%, increase.
If the stock then rises from $100 to $200, that is another $100 increase but only a 100% gain.
On a linear chart, the $100 move from $100 to $200 would occupy exactly the same vertical distance as the entire move from $0 to $100.
This can make the earlier part of the stock’s history appear almost insignificant.
For example, the monthly chart of SPX on a linear scale makes the 1987 Black Monday crash look insignificant…
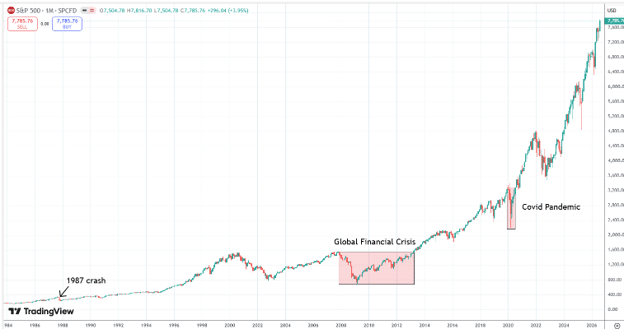
An observer might incorrectly assume the 1987 drawdown was small or that the Global Financial Crisis was comparable in magnitude to the COVID-19 crash.
In reality, the logarithmic scale provides a more accurate picture.
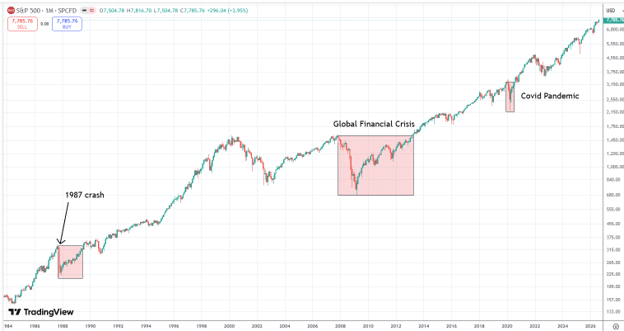
The 1987 crash and the COVID-19 pandemic both involved roughly 33% drawdowns, whereas the Global Financial Crisis saw the worst drawdown of a 56% decline.
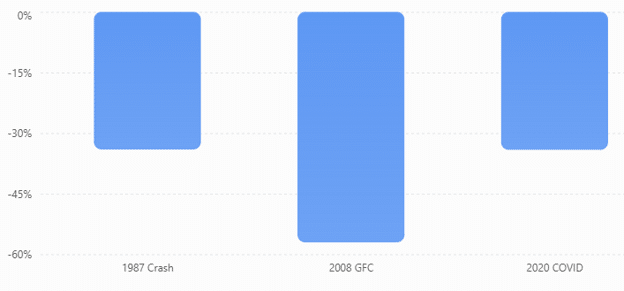
An investor entirely invested in SPX would have lost more than half the account at some point during the Global Financial Crisis and would have taken over 5 years to recover.
In contrast, the Covid pandemic drew down one third the account and took less than a year to recover.
Strategy Equity Curves
Logarithmic scaling is equally important in backtested strategy equity curves.
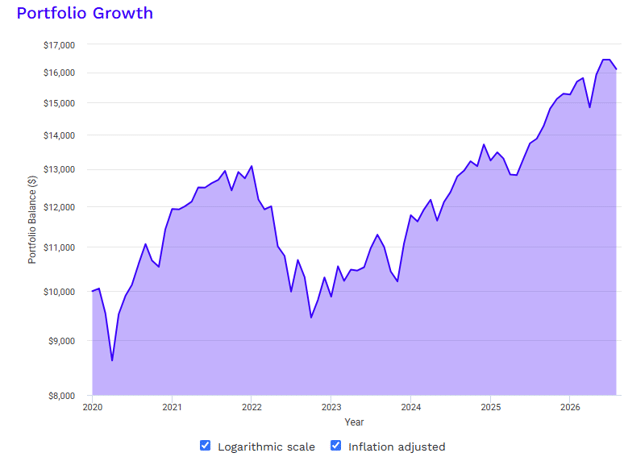
A backtest over long periods can make early drawdowns insignificant when they really are.
Here is a backtest result of a portfolio with a mixture of large cap, small cap, gold, bond, and real estate rebalanced on an annual basis.
Maybe it looks fine when charted like this on a linear scale.
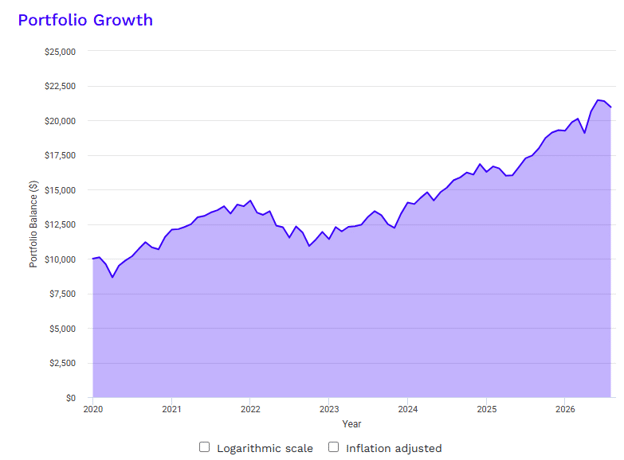
Source: PortfolioVisualizer
However, when charted on logarithmic scale and inflation adjusted, it paints a different picture.
Are Prices Accurate On A Logarithmic Scale?
Yes.
Prices read off the logarithmic scale are accurate.
Only the visual spacing distance of price markings are intentionally different from a linear scale.
Logarithmic charts do not distort price data; they merely adjust the visual spacing.
$100 remains $100, and $200 remains $200.
The logarithmic scale ensures that equal percentage changes are represented by equal vertical distances.
This provides a better view of actual percentage returns, which is crucial when assets experience substantial growth.
Trendlines Are Often More Meaningful On A Log Chart
Logarithmic scales also offer advantages for technical analysis.
If a stock consistently gains 10% annually, its trend will look increasingly steep on a linear chart because the dollar gains grow larger over time.
On a logarithmic chart, however, constant percentage growth appears as a straight line, making long-term trends, channels, and patterns easier to interpret.
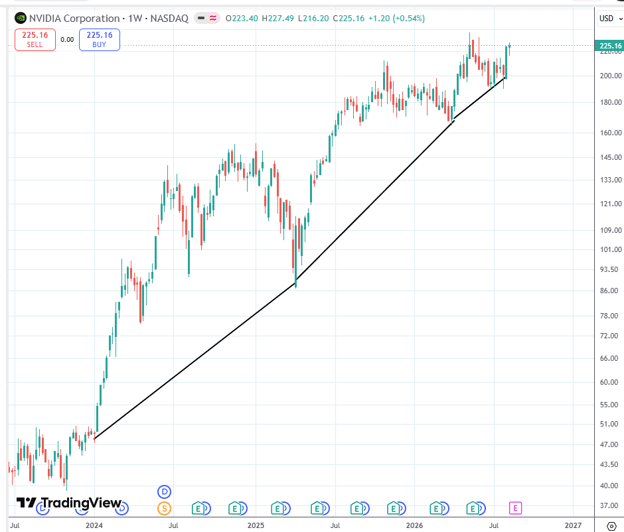
For example, while NVDA may appear to have accelerating growth on a linear scale
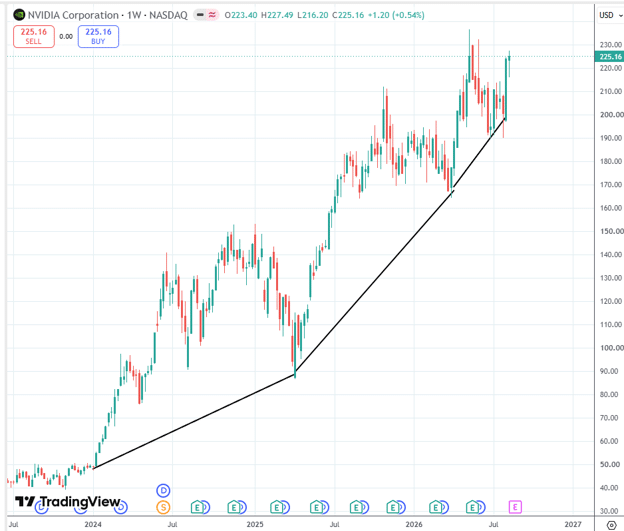
A logarithmic scale reveals it is growing at a more constant rate on a straight trendline trajectory.
Why Options Traders Should Care About Log Scale
For options traders, logarithmic scaling has two specific applications that go beyond general chart reading.
Equity curve analysis.
If you’re backtesting or reviewing the performance of your options income strategy over multiple years, always view the equity curve on a logarithmic scale.
A linear equity curve can make a devastating early drawdown look trivial if the account has since grown significantly.
The logarithmic view shows you the true percentage drawdown at each point in time, which is the number that actually matters for assessing whether a strategy is survivable.
Underlying stock selection.
When selecting stocks for covered calls, the wheel strategy, or put selling, viewing the long-term chart on a logarithmic scale helps you assess whether a stock’s apparent momentum is genuine or partly a function of chart scaling.
NVDA’s linear chart makes 2024 look like its best year.
The log chart correctly shows 2023 was stronger on a percentage basis.
For an options income trader selling covered calls against NVDA, understanding whether the stock is maintaining a consistent growth trajectory or genuinely accelerating changes your assessment of strike selection and directional bias.
Trendline placement for strike selection.
The trendline observation in the article is directly applicable to options traders who use technical support and resistance for strike selection.
A trendline drawn on a logarithmic scale is more meaningful for a stock that has experienced significant price appreciation — it represents a consistent percentage growth rate rather than an absolute dollar rate.
For a stock like NVDA, placing a bull put spread strike below a logarithmic trendline support is more technically robust than using a linear trendline at the same level.
FAQ
When Should I Use A Linear Chart vs A Logarithmic Chart?
Use a linear chart when you’re looking at a short time period (days to a few months), when the stock’s price range is relatively small, or when you care specifically about absolute dollar movements.
Use a logarithmic chart when analysing a stock over multiple years, when the stock has experienced substantial price growth, or when you want to compare percentage moves across different price levels.
For most long-term technical analysis, the logarithmic chart provides a more accurate representation of the stock’s true performance.
Do Logarithmic Charts Distort Prices?
No, prices read from a logarithmic chart are completely accurate.
$100 is still $100 and $200 is still $200.
The only thing that changes is the visual spacing of the price levels.
On a log chart, equal vertical distances represent equal percentage changes (e.g., a doubling of price always occupies the same vertical space).
On a linear chart, equal vertical distances represent equal dollar changes.
Neither distorts the prices themselves; they simply present them differently.
How Do I Switch To Logarithmic Scale On TradingView?
Right-click on the price axis (the vertical axis on the right side of the chart) and select “Log Scale” from the context menu.
Alternatively, press the “L” key as a keyboard shortcut.
You can also click the settings gear icon and look for the scale options.
The toggle is remembered for each chart independently, so you can have some charts on linear and others on log scale simultaneously.
Why Does The 1987 Crash Look Small On A Linear SPX Chart?
Because the linear chart shows absolute dollar moves, and the S&P 500’s dollar value in 1987 was a small fraction of its current level.
A 33% drawdown from a lower base produces a small absolute dollar decline compared to a 10% drawdown from today’s much higher level.
The logarithmic chart corrects for this by showing all moves as percentages.
So the 1987 crash and the COVID crash, which were both approximately 33% drawdowns, appear the same size on the log chart, as they should.
Are Trendlines More Accurate On A Logarithmic Scale?
For stocks that have experienced significant price appreciation, yes.
A trendline on a linear chart connects points of equal absolute dollar distance from the trend, which means the line becomes increasingly steep as the stock price rises.
A trendline on a logarithmic chart connects points of equal percentage distance from the trend, which appears as a straight line for constant percentage growth.
For long-term trend analysis of growth stocks, the logarithmic trendline more accurately represents the stock’s actual growth trajectory.
Want to Apply Better Technical Analysis to Your Options Income Trades?
Understanding how to read charts — including when to use logarithmic scale — is one part of a complete options income framework.
Options Income Mastery covers how to combine technical analysis with options income strategies, including strike selection, entry timing, and trade management for covered calls, bull put spreads, and the wheel strategy.
Learn more about Options Income Mastery →
Conclusion
A linear chart is perfectly fine when:
- You are looking at a relatively short time period such as a daily chart.
- The stock’s price range is relatively small.
- You care about absolute dollar movements.
- You are analyzing a specific trading setup over days or weeks.
But when analyzing a stock over many years, especially one that has experienced substantial growth, a logarithmic price scale is usually the better choice.
We had seen differences even on just a weekly chart.
The key distinction to remember is that a linear chart is more representative of dollar changes and a logarithmic chart is more representative of percentage changes.
We hope you enjoyed this article on when to use a logarithmic scale for price charts.
If you have any questions, please send an email or leave a comment below.
Trade safe!
Disclaimer: The information above is for educational purposes only and should not be treated as investment advice. The strategy presented would not be suitable for investors who are not familiar with exchange traded options. Any readers interested in this strategy should do their own research and seek advice from a licensed financial adviser.