
Calendar spreads are typically thought of as having positive theta, meaning they gain value over time.
This is true only of calendars where the strike price of their options are near-the-money.
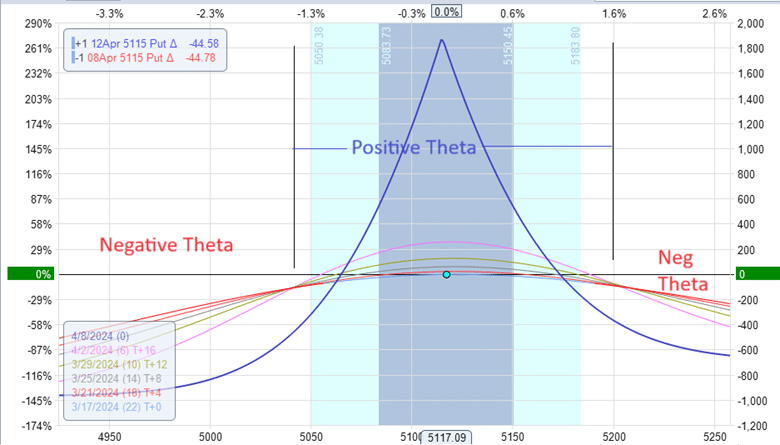
For example, below is a typical at-the-money calendar on SPX with the short put option 22 days to expiration.
And four days after that, the long put option.
Date: March 15, 2024
Price: SPX @ $5117
Sell one April 8 SPX 5115 put @ $52.30
Buy one April 12 SPX 5115 put @ $59.20
Debit: -$690

The Greeks are:
Delta: 0.13
Theta: 3.5
Vega: 43
Currently, the trade has a positive theta of 3.5, which means time is in our favor. As time passes, the trade benefits (assuming all other things remain the same).
However, this is only true if the underlying price stays close to the strike prices of the calendar.
If the price moves too far away, the trade becomes a negative theta trade, and we lose money to time decay for each day we hold the trade.
The point at which the calendar transitions from a positive to a negative theta is marked off in the above graphic.
It happens at the point where all the T-line crosses.
The T+0 line is the profit/loss curve today.
The T+4 line is the profit/loss curve four days from now.
The above graphic shows the T+4, T+8, T+12, and T+16 lines.
The solid blue line is the profit/loss curve at the expiration of the near-dated option (in our case, April 8).
We read the profit/loss curves because the higher the point on the curve, the higher our profit is, as noted by the dollar value on the right vertical axis.
The bottom horizontal axis shows the underlying price (in our case, SPX).
As the price of SPX moves left and right along the bottom horizontal axis, we read off the projected profit based on the curves.
For a given price of SPX on the horizontal axis, we look at the stacking of the T-lines.
If the T+4 line is above the T+0 line, we know theta is positive for that SPX price.
This means that four days from now, our profit will be higher than it is now if SPX stays at the same price.
If the T+4 line is below the T+0 line, it is the opposite.
Our profit will decrease in the future even if SPX stays at the same price (we assume volatility stays the same to keep things simple).
This is indicative of a negative theta.
It might be difficult to read the difference between the T+0 and T+4.
You can compare the T+0 and T+16 if that is easier to see.
As time progresses, the T+0 line will morph into the shape of the T+4 line, then into the shape of the T+16 line, and eventually into the shape of the expiration graph.
As time and volatility change, the transition point at which the calendar becomes negative theta can change.
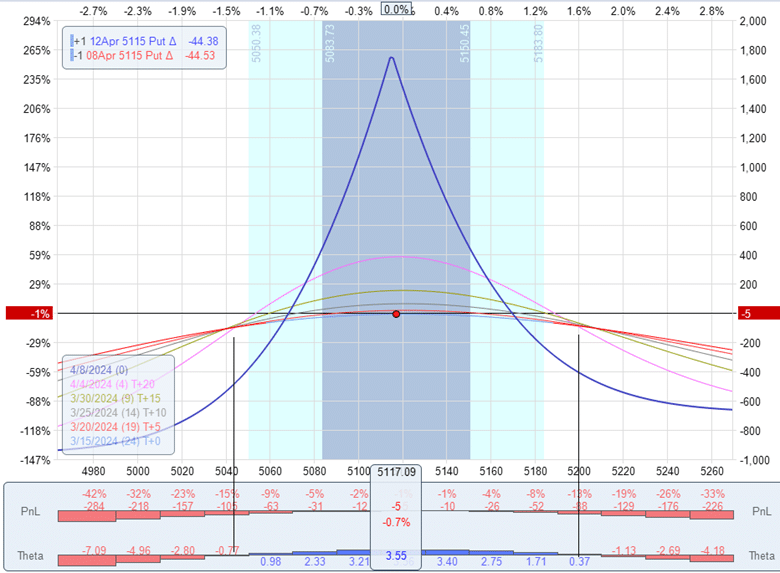
OptionNet Explorer has a histogram showing when theta is positive (blue histogram) and when theta is negative (red histogram).

You see that the transition point corresponds to the cross-over point of the T-lines.
Conclusion
In any case, it is not necessary to fully understand the nuance of when and where the theta changes from positive to negative.
Just know that if you are putting on a calendar to generate income, you must watch the theta to ensure that you are still getting positive theta.
You can simply read off the Greeks from your analytical software.
An easy rule of thumb is that if the price is inside and underneath the expiration graph, you will likely get a positive theta.
We hope you enjoyed this article on when Calendar Spreads have negative theta.
If you have any questions, please send an email or leave a comment below.
Trade safe!
Disclaimer: The information above is for educational purposes only and should not be treated as investment advice. The strategy presented would not be suitable for investors who are not familiar with exchange traded options. Any readers interested in this strategy should do their own research and seek advice from a licensed financial adviser.


