
Contents
There is some merit to the analogy that the market is a breathing mechanism.
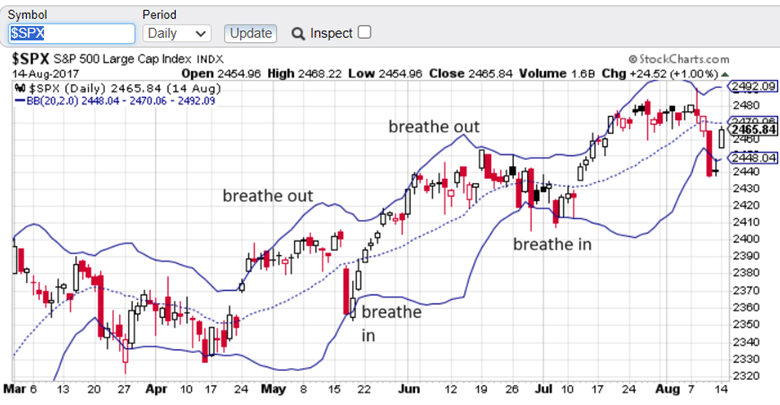
Today, we are not talking about the breath of the market, but rather the breadth of the market.
The breadth of the market refers to the extent or the number of stocks participating in a particular market movement.
A market with broad breadth means that many stocks are participating in the overall trend, indicating a widespread and sustained movement.
This is often considered a positive sign because it suggests that the market movement is supported by a wide range of stocks, making it more likely to be a robust and enduring trend.
A market with narrow breadth means only a small handful of stocks are driving a market movement.
This could indicate a less sustainable or more fragile trend, as only a few individual players support the market movement.
Breadth indicators are tools used by analysts to measure the breadth of the market and assess the strength of a trend, not to be confused with breath analyzers for testing sobriety.
Different Breadth Indicators
There is a wide variety of such indicators, including metrics like the advance/decline line, up/down volume ratio, the number of stocks making new highs or lows, etc.
One of my favorites is the percentage of stocks above the 50-day moving average on the SPX (S&P 500 index).
I can get this metric on StockCharts.com by entering the symbol $SPXA50R
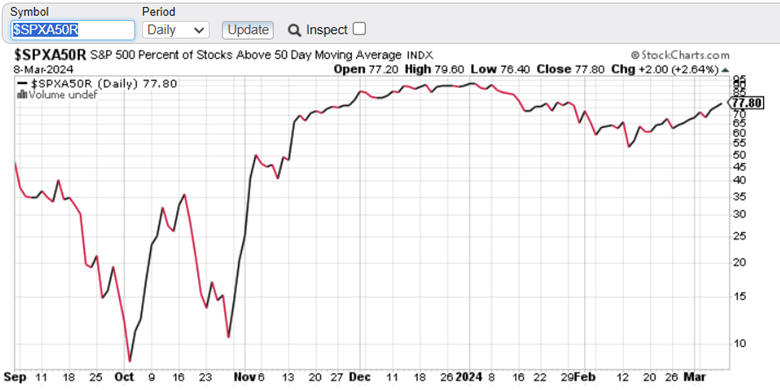
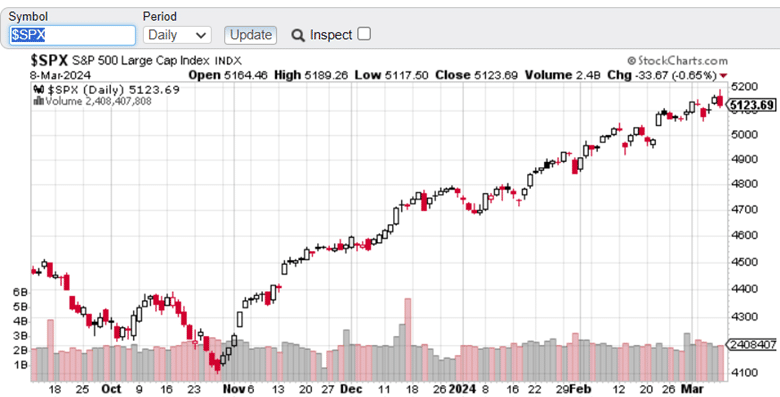
At the time of this writing on March 8, 2024, we see that about 78% of the stocks in the S&P 500 are above their 50-day moving average.
This suggests a good participation in the corresponding uptrend of the SPX…
You can get similar metrics for other indices (such as Nasdaq and Dow) and different moving averages (such as above 20-day or 200-day moving averages).
Simply search for Symbols containing “Percent Above” in their description, and you will get a list of symbols.
The breadth for the Nasdaq 100 index is $NDXA50R.
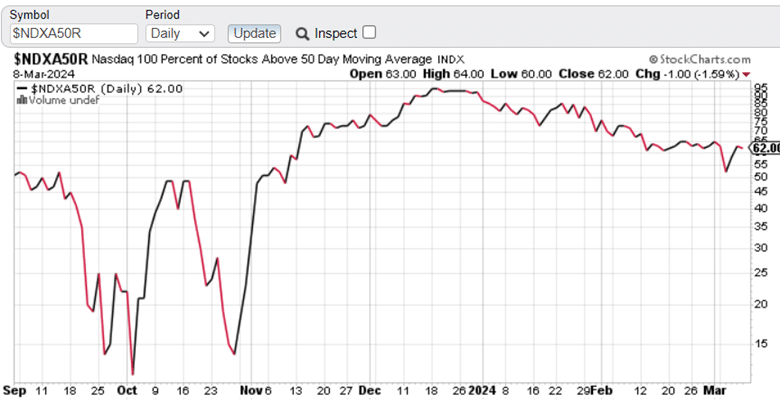
And for the DOW…
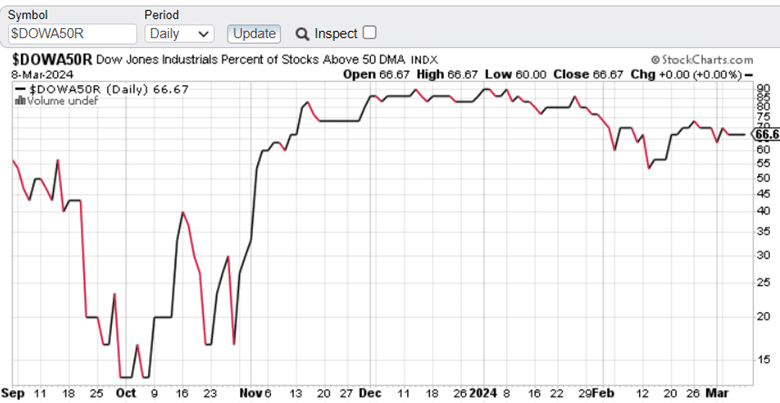
In this way, we can get a sense of the relative strength of each index.
Frequently Asked Questions
Why is there no breadth indicator for the Russell 2000 index?
For some reason unknown to me, StockCharts does not have a similar symbol for the RUT index.
Why are these breadth symbols not found in other charting software?
Although you might be able to get similar information on other platforms, these particular breadth symbols are specific to StockCharts. So, you may be unable to put these symbols into other charting platforms.
How often are these breadth indicators updated?
They are calculated and updated at the end of each day.
What does it mean to be above the 50-day moving average?
Take a stock like Nvidia (NVDA), part of the S&P 500, and plot the 50-day moving average line (blue line below).
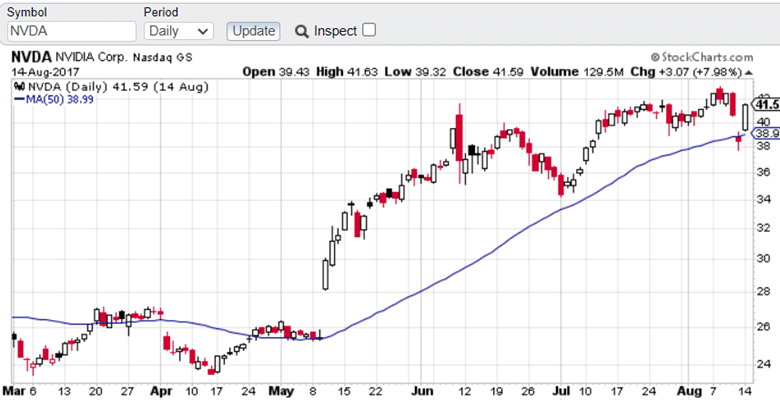
If the price of NVDA is above this line at the time (which it is in the picture), then it is above the 50-day moving average.
The 50-day moving average is calculated by averaging the closing prices of a stock over the last 50 trading days.
It is called “moving” because it is recalculated daily when a new closing price is available and the oldest price is dropped off.
Is it an exponential moving average or a simple moving average?
These breadth indicators are based on a simple moving average because the description of the symbols says “day moving average.”
Had it been an exponential moving average, the word “exponential” would have been mentioned in the description.
Conclusion
Investors and traders need to know the state of the market. While there are many other important factors to look at, the market breadth is another piece of information to consider.
We hope you enjoyed this article on the best breadth indicator.
If you have any questions, please send an email or leave a comment below.
Trade safe!
Disclaimer: The information above is for educational purposes only and should not be treated as investment advice. The strategy presented would not be suitable for investors who are not familiar with exchange traded options. Any readers interested in this strategy should do their own research and seek advice from a licensed financial adviser.


