





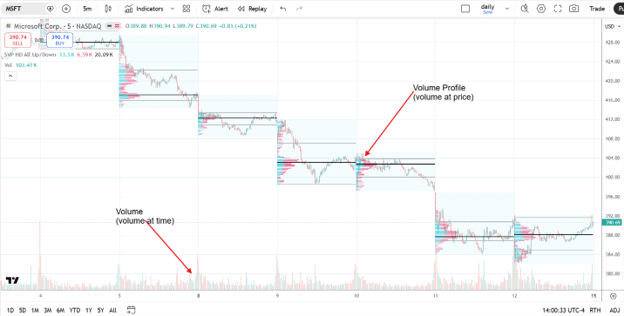
We are all familiar with the volume histogram at the bottom of the chart.
But that only tells you the volume of transactions at a certain time.
What is more important is to know the volume of transactions at a certain price.
This is known as the volume profile that many institutional traders use.
 Many retail traders don’t have access to this volume profile information because there are not that many trading platforms that offer this indicator for free.
While TradingView does offer the Fixed Volume Profile without a subscription, its more important Session Volume Profile and Periodic Volume Profile does require at least the “Essential” plan (the least expensive subscription) in order to see the session volume profiles.
We will learn all these terminology and how to enable the various volume profiles in TradingView.
Contents
- TradingView’s Session Volume Profile
- High Volume Nodes (HVNs)
- Low Volume Nodes (LVNs)
- Virgin Point Of Control (VPOC)
- Weekly Volume Profile
- Visual Range Volume Profile
- Fixed Range Volume Profile
- Quasi Real Time Volume Profile
- FAQ
- Conclusion
TradingView’s Session Volume Profile
To place the Session Volume Profile on a TradingView chart, search “Volume Profile” in its indicators and select “Session Volume Profile HD”…
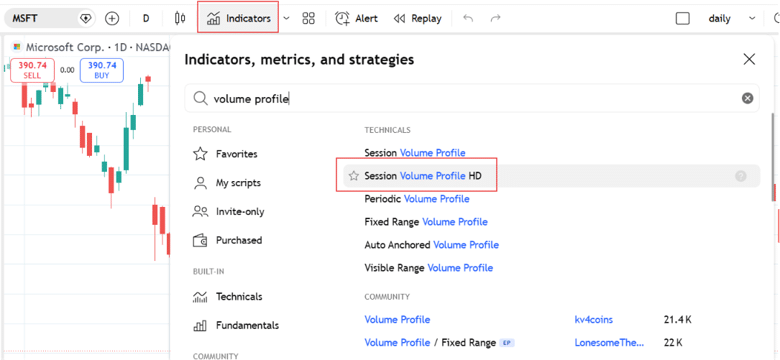
We are only using TradingView’s built-in indicators today.
So pick the one listed in the “Technicals” section and not the “Community” section.
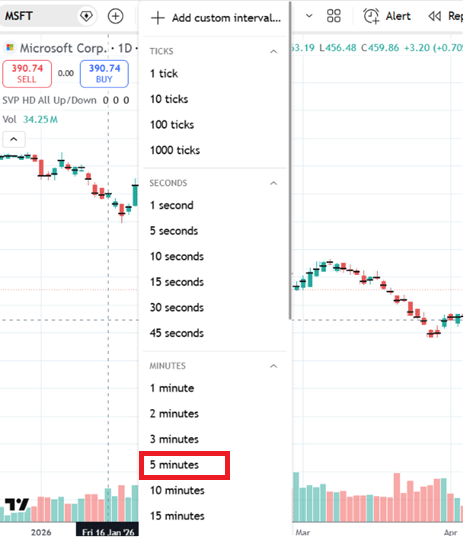
Next, change the chart to a 5-minute intraday chart where each candle represents 5-minutes…
If you see yellow sections in the chart, it means that you are showing extended trading hours.
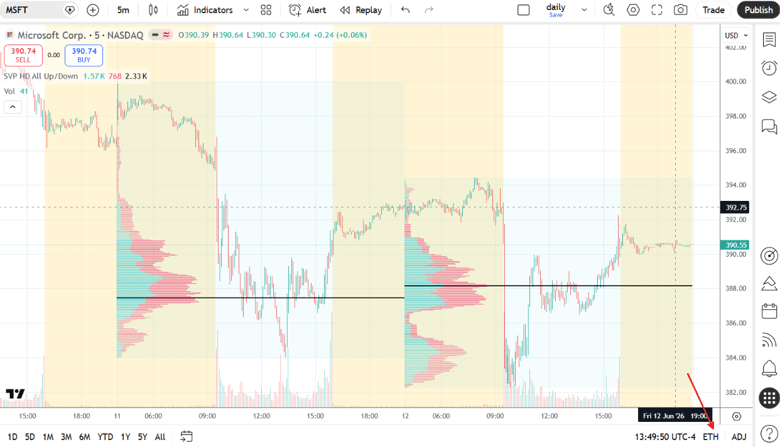
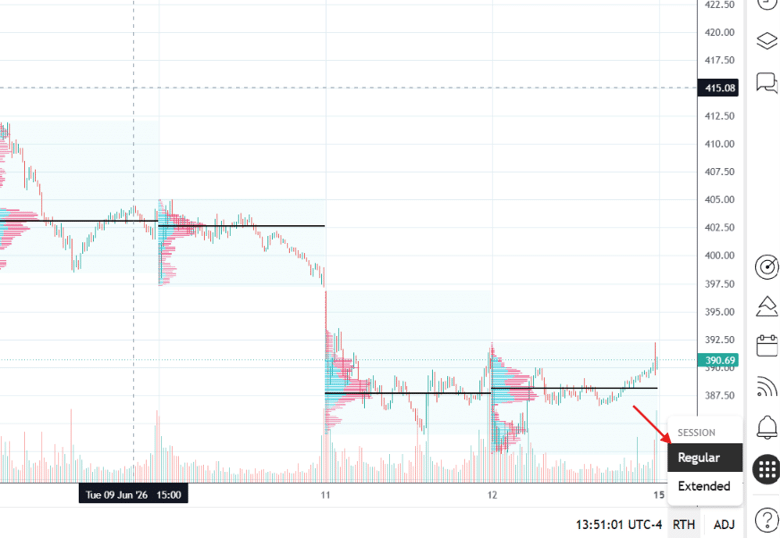
To keep things simple, switch this to regular trading hours…
Clicking on the “SVP” (session volume profile) indicator settings…
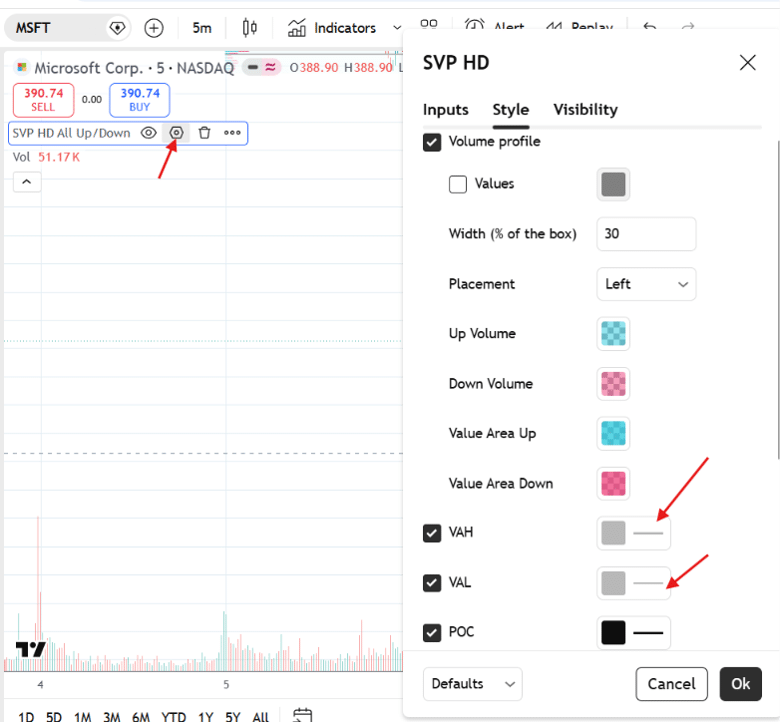
We enabled the “VAH” and “VAL” and changed the color of the lines to grey.
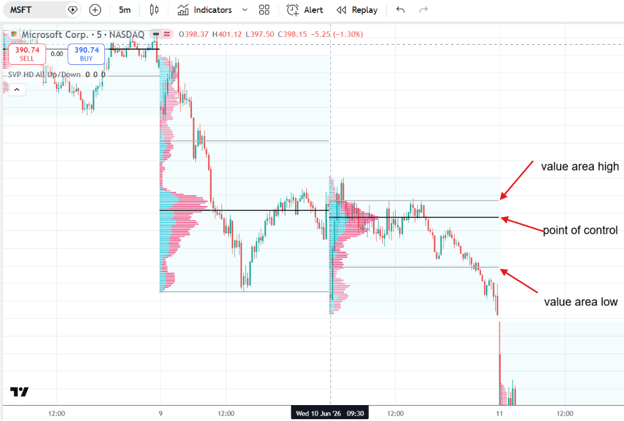
This setting displays the Value Area High (VAH) and Value Area Low (VAL) lines on the Volume Profile.
These lines are typically shown in a slightly lighter color than the Point of Control (POC) line.
The POC represents the price level that traded the highest volume during the trading session.
As such, it can be considered the most important price level of the session.
Traders should not think of it as a single price line across the chart, but rather a high activity price zone around that price.
The Value Area encompasses approximately 70% of the total volume traded during that session.
The Value Area High marks the upper boundary of this price range, while the Value Area Low marks the lower boundary.
Together, the VAH and VAL help traders identify the price range where the majority of trading activity occurred, often serving as important areas of support and resistance.
High Volume Nodes (HVNs)
One of the most useful features of the Volume Profile is its ability to reveal the price levels where the market spent the most and least amount of time.
High Volume Nodes are the bulges or peaks in the Volume Profile.
They represent price levels where a large amount of volume was transacted.
These areas form because buyers and sellers found a price to be fair and were willing to conduct significant business there.
As a result, HVNs often become areas of acceptance.
When price reaches an HVN, it will frequently slow down, consolidate, or trade sideways, because price is unable to move quickly through a congested trading area.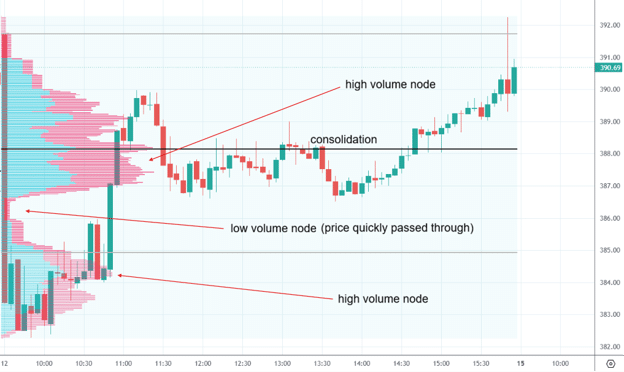
Low Volume Nodes (LVNs)
On the other hand, Low Volume Nodes represent prices where relatively little trading occurred.
The market moved through these prices quickly because buyers and sellers did not spend much time agreeing on value there.
See how the 5-minute green candle at 10:45am went quickly from $384 to $387 passing through the low volume node.
When price enters an LVN, it will frequently move rapidly through the area with less resistance targeting the next HVN.
In the terminology of smart money concepts, we can say that low volume nodes are like “fair value gaps”.
A common principle of auction market theory is that price moves quickly through areas of rejection and slowly through areas of acceptance.
The LVN is an area of rejection.
The HVN is an area of acceptance.
Virgin Point Of Control (VPOC)
A Virgin Point of Control occurs when a session’s POC has not been revisited by price in subsequent sessions.
The POC represents the price where the most business was conducted.
Many market profile traders believe that the market has a tendency to revisit significant unfinished auction levels.
For this reason, Virgin POCs often act as future support and resistance, and as magnets for price.
The market tends to gravitate to areas of high liquidity, such as the point of control.
A Virgin POC is not a guarantee that price will return.
Some Virgin POCs remain untouched for weeks, months, or even years.
However, experienced market profile traders often keep these levels plotted because they can become important reference points when price eventually approaches them.
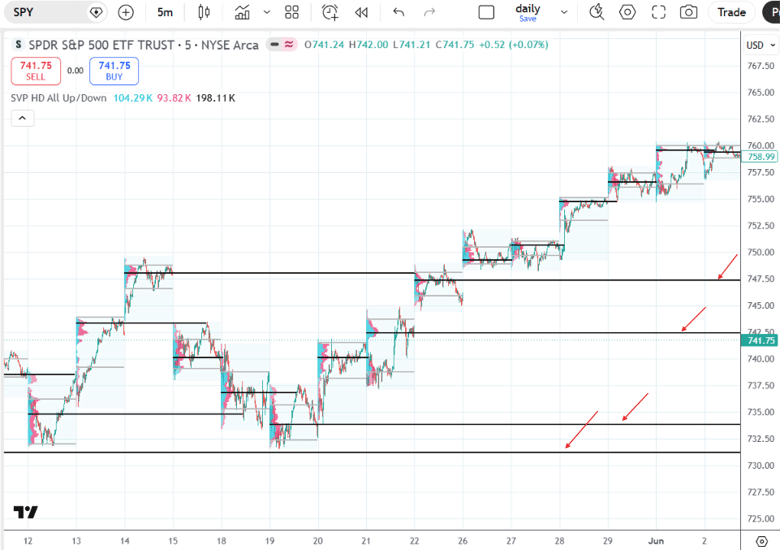
In Tradingview, you can extend the POC line to better see the virgin point of controls.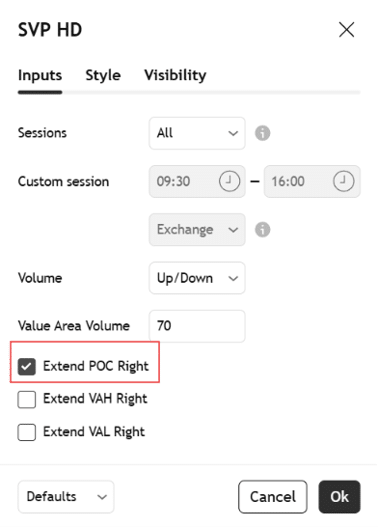
On June 2nd, 2026, there were four VPOC’s below current price on the SPY chart that remained untouched…
In the next few sessions during a market sell-off, the SPY returned back to those levels and the four points of controls are no longer virgin.
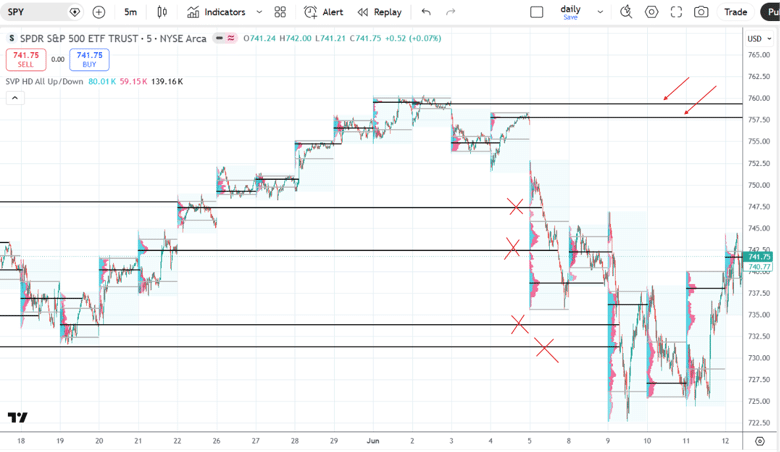
It then left two new VPOCs above price.
At some point (no one knows when), it is expected that SPY will reach up to touch those levels.
Weekly Volume Profile
For those who want to trade on a longer timeframe, we can use the “Periodic Volume Profile”…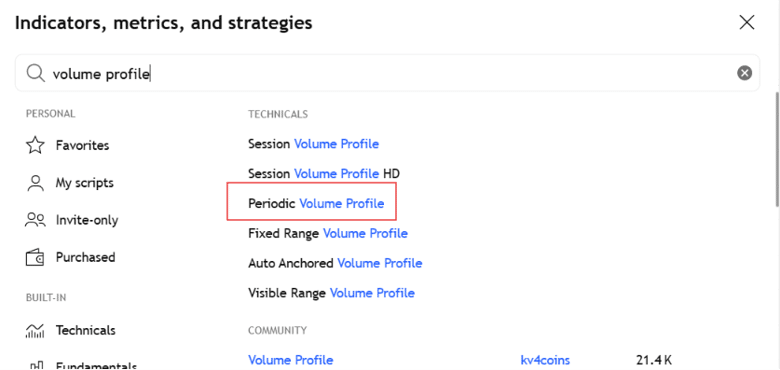
And set the period of the volume profile to be one week.
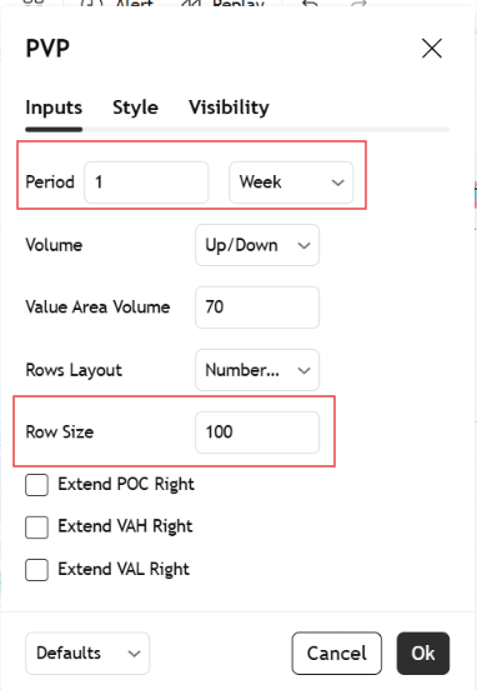
Increase the “row size” if you want higher resolution.
Here is a one-hour chart of AAPL with the weekly volume profile.
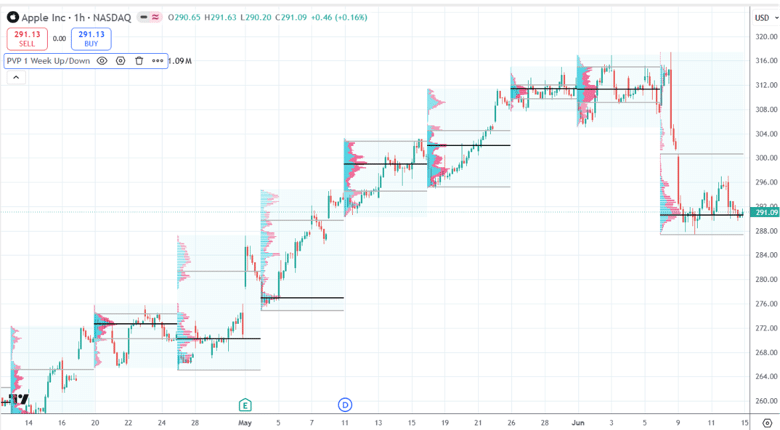
Or you can try the daily chart with a monthly volume profile.
Visual Range Volume Profile
We can add another indicator called the “Visual Range Volume Profile”.
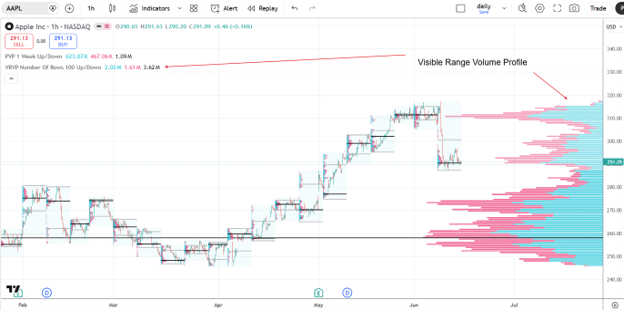
It shows the volume profile of whatever visual portion of the chart you have on the screen.
Fixed Range Volume Profile
The “Fixed Range Volume Profile” is the volume profile that is available in TradingView without a subscription.
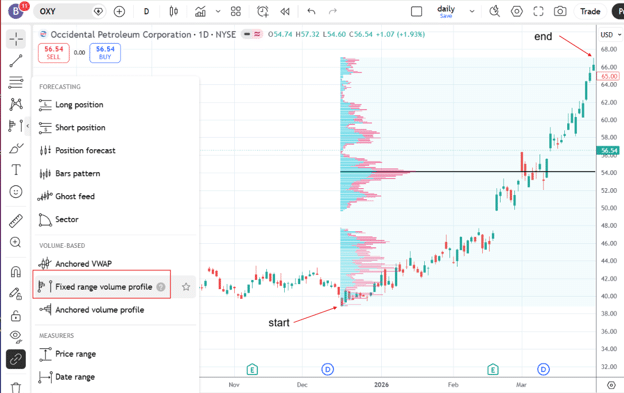
It enables you to drag a starting point and end point and it will draw the volume profile for that range.
For example, if we wanted to know what was the important price level during the OXY uptrend, we would draw as in the above and see that price around the $54 level appears to be what buyers and sellers deem to be fair value as that is the POC where the most transactions happened.
And as it later turned out, when price returned back to the $54 level, it bounced at that level.
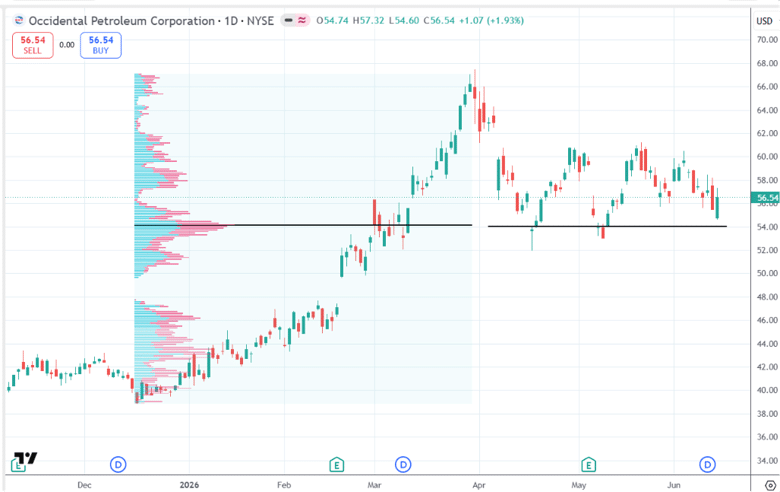
The POC acted as support.
Quasi Real Time Volume Profile
TradingView’s volume profiles are often described as “quasi real time” rather than true real time because of how TradingView receives and processes market data.
TradingView’s Volume Profile is reconstructed from chart data and volume statistics, while a true real time Volume Profile is built directly from every individual trade as it occurs on the exchange.
As a result, TradingView’s profile is an estimate of where volume traded, whereas professional order flow platforms such as Sierra Charts, Bookmap, and Deep Charts can display the exact volume traded at each price level.
For most swing traders and chart analysts, the difference is usually small.
The major levels, Point of Control, Value Area High, and Value Area Low are often reasonably accurate.
FAQ
Do I Need A TradingView Subscription To Use Volume Profile?
Yes, for the most useful variants.
The Fixed Range Volume Profile is available on TradingView’s free plan.
The Session Volume Profile (the most commonly used for intraday traders) and the Periodic Volume Profile require at least the “Essential” plan — TradingView’s lowest paid subscription tier.
Traders who rely heavily on volume profile analysis will typically find the Essential plan worthwhile for this feature alone.
What Is The Difference Between Volume Profile And Standard Volume?
Standard volume (the histogram at the bottom of most charts) shows how many transactions occurred at a particular point in time.
Volume Profile shows how many transactions occurred at a particular price level, regardless of when they happened.
Price-based volume is generally considered more useful for identifying support and resistance because markets respond to price levels, not to timestamps.
What Is The Point Of Control (POC) In Volume Profile?
The Point of Control is the price level at which the most volume was traded during the selected period — whether that’s a single session, a week, or a custom range.
It represents the “fairest price” as determined by the market, and often acts as a significant support or resistance level when price returns to it.
The OXY example in this article illustrates this directly: the $54 POC from a previous uptrend acted as support on the return visit.
What Is A Virgin Point Of Control?
A Virgin Point of Control (VPOC) is a session’s Point of Control that has not been revisited by price in subsequent sessions.
Market profile traders watch these levels because price tends to return to areas of high liquidity over time.
VPOCs can remain untouched for days, weeks, or months — but when price approaches them, they often act as strong support or resistance.
Is TradingView’s Volume Profile Accurate?
TradingView’s Volume Profile is reconstructed from chart data rather than from a live tick-by-tick feed, which makes it “quasi real-time” rather than truly real-time.
For most retail swing traders and chart analysts, the difference is small — the major levels (POC, VAH, VAL) are typically accurate enough for practical use.
Professional order flow traders who need tick-accurate data generally use dedicated platforms such as Sierra Charts or Bookmap.
How Is Volume Profile Used In Options Trading?
Volume Profile levels — particularly the POC, VAH, and VAL — can help options traders identify high-probability price zones for strike selection.
A short put strike placed at or below a well-established VAL or HVN has a technical basis for holding.
Similarly, iron condor wings placed outside the Value Area boundaries align the options structure with market-determined price acceptance zones, adding a technical layer to the probability-based strike selection process.
Want to Combine Technical Analysis With Options Income Strategies?
Volume Profile is one of the technical tools covered alongside options income strategies in Options Income Mastery — including how to use support and resistance levels from market profile to improve strike selection on bull put spreads, iron condors, and the wheel strategy.
Conclusion
Today we covered only the fundamentals and terminology of Volume Profile.
We have not yet explored the specific trading strategies that traders use with it.
However, you now understand how to access and interpret a type of market information that many institutional traders rely on.
With that foundation in place, you are one step closer to incorporating Volume Profile into your own analysis and potentially taking your trading to the next level.
For traders who want to see how Volume Profile integrates with options trading — specifically how the POC and Value Area levels can be used to select put spread strikes and iron condor ranges — see our guides on bull put spreads and iron condors.
Identifying high-probability price levels through Volume Profile and then placing defined-risk options structures around them is a powerful combination.
We hope you enjoyed this article on enabling the Volume Profile on TradingView.
If you have any questions, please send an email or leave a comment below.
Trade safe!
Disclaimer: The information above is for educational purposes only and should not be treated as investment advice. The strategy presented would not be suitable for investors who are not familiar with exchange traded options. Any readers interested in this strategy should do their own research and seek advice from a licensed financial adviser.