


The full name of this technical chart indicator is Ichimoku Kinko Hyo, which is Japanese for “one glance equilibrium chart”.
The indicator is designed to provide a lot of information at once in a visual way.
And traders proficient in reading it can see it at a glance.
With practice, you will be able to go through your watchlist very quickly, taking one glance at each chart to get an overall feel for the stock and whether it is in trouble.
The Ichimoku tells the trader the trend, its strength, buy/sell signals, and support/resistance levels.
It was originally designed for use on daily charts and is not ideal for timeframes shorter than 4-hour charts.
It works best in trending markets and will give conflicting signals in sideways markets.
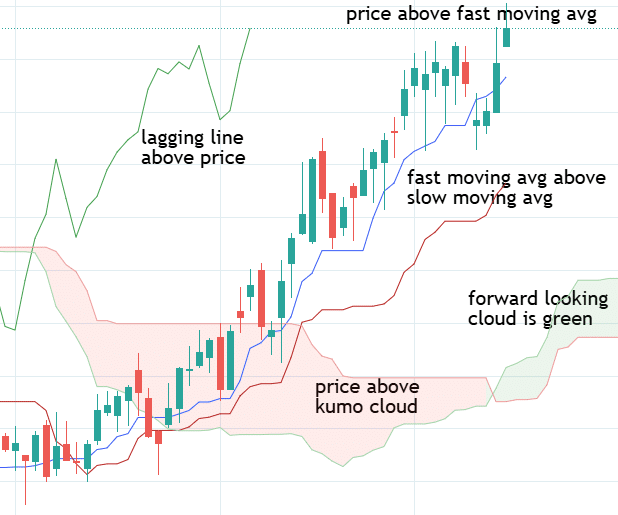
The Ichimoku system uses five components: the Tenkan-sen (fast moving average), Kijun-sen (slow moving average), Senkou Span A, Senkou Span B, and the Chikou Span (lagging line).
Together, these components create the “cloud” (Kumo) and define the overall bias of the chart.
Understanding each component in isolation before reading them together is the foundation of applying the system confidently.
Because the Ichimoku packages so much data into a single overlay, it is important to understand what each component is telling you individually before combining them.
The sections below walk through each signal type with accompanying charts to illustrate how to identify bullish and bearish conditions at a glance.
Contents
- Bullish Use Cases
- Price Closing Below The Slow Moving Average Is A Sell Signal
- Moving Average Cross-Over
- Lagging Line Crossing Below Price Is A Sell Signal
- Price Piercing Into The Cloud From Above Is A Sell Signal
- Price Inside The Cloud: Neither Bearish Nor Bullish
- Span B Line Represents A Strong Support And Resistance Level
- Kumo Twist
- Price Crossing Span B From Above Is A Sell Signal
- Reversal To The Upside
- Lagging Line As Confirmation
- Summary
Bullish Use Cases
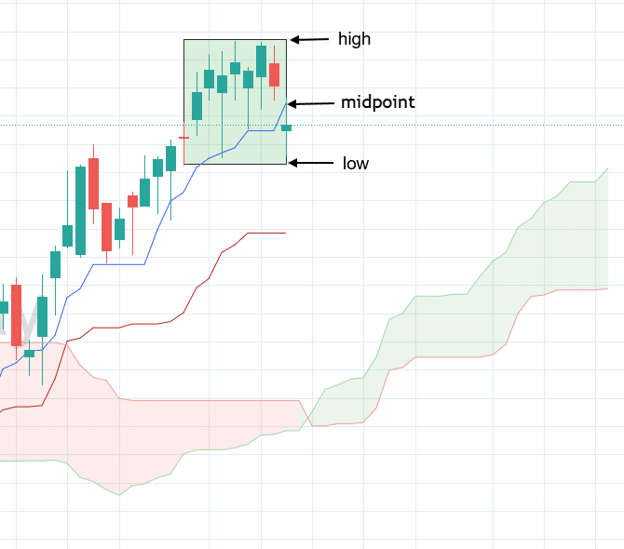
Unlike traditional moving averages, the Ichimoku moving averages are calculated as midpoints rather than averages of closing prices.
The fast line (blue line) is the midpoint between the highest high and lowest low over the last 9 candles.
A short-term momentum trader can follow the price trend until it closes below the fast line (as was the case in the picture above).
Price Closing Below The Slow Moving Average Is A Sell Signal
A longer-term swing trader can follow the trend until the price breaks below the slow-moving average line (red line), which uses the high and low of 26 candles to calculate its midpoint average.
This is seen here…
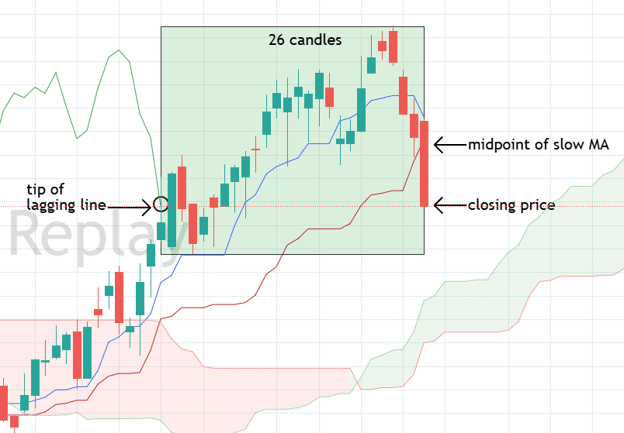
The tip of the lagging line is the closing price plotted 26 candles behind.
Moving Average Cross-Over
When the fast-moving average crosses below the slow-moving average, that is a sell signal (as shown below).
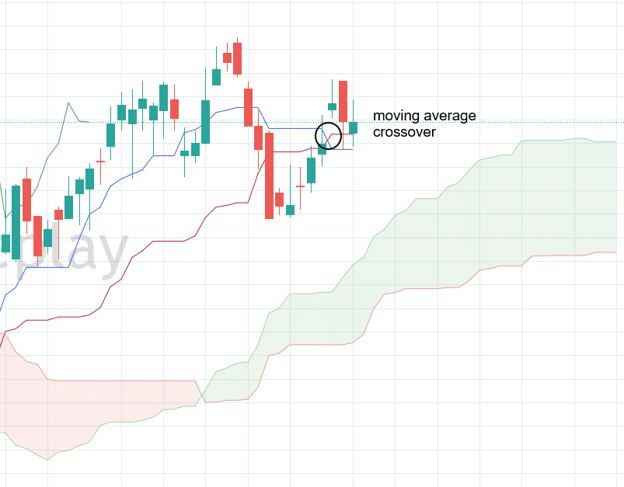
Like all moving average crossover strategies, it is not to be used in isolation.
It is just one piece in the preponderance of evidence we will use to build a case for a chart’s bearishness or bullishness.
While this sell crossover is happening, the lagging span being above price and the price being above cloud are both indicating bullishness in the longer term.
So the sell signal is just a forewarning of potential slowing momentum.
A practical way to apply this is to require at least two or three components to align before acting.
For example, if the fast-moving average crosses below the slow-moving average, but the price is still well above the cloud and the lagging line remains above the price, a trader might reduce position size rather than exit entirely, treating the crossover as caution rather than a confirmed signal to reverse.
The more components that agree, the greater the conviction in the directional read.
Lagging Line Crossing Below Price Is A Sell Signal
As shown below, the lagging line has pierced the candlesticks from above.
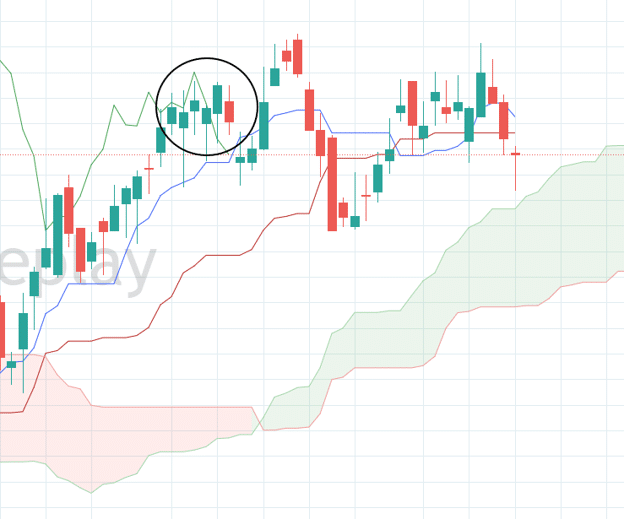
That is a sell signal.
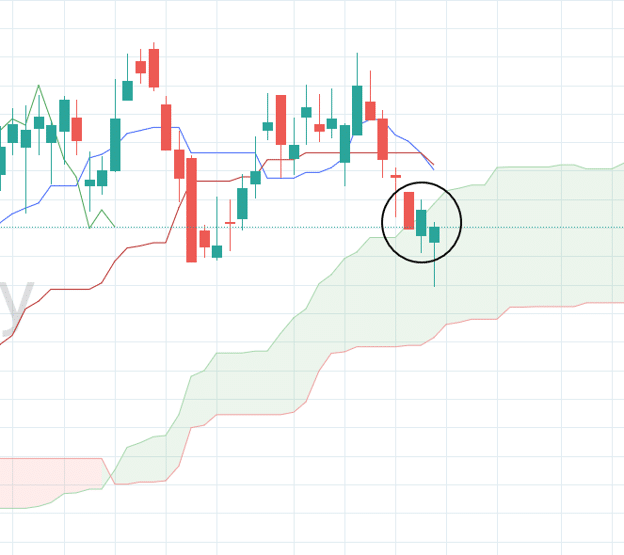
Price Piercing Into The Cloud From Above Is A Sell Signal
Below, we see that the price dropped below the first boundary of the cloud (Span A).
This is a sign that the prior bullishness is disappearing.
Price Inside The Cloud: Neither Bearish Nor Bullish
The below, with the price stuck inside the cloud, represents fair value or equilibrium.
We also see that moving average lines are located where the price is.
Since you cannot make money selling and buying at fair value, directional traders will not trade when the price is inside the cloud.
But this would be a great candidate for an iron condor or other non-directional options trading strategies, such as at-the-money calendars and butterflies.
Also, look at where the tip of the lagging line is on the chart above.
It is right on a price candle.
The lagging line neither indicates bullish nor bearish.
Options traders can take advantage of price-inside-cloud conditions by deploying range-bound strategies.
A short strangle placed with strikes just outside the cloud boundaries, for example, profits as long as the price remains trapped within the range.
The wider the cloud, the more room the trade has before it is tested.
These neutral strategies perform best when the Ichimoku’s lagging line is flat and neither above nor below the price, confirming that no trend is emerging.
The lagging line is the closing price shifted 26 candles back.
Right now, the price is exactly where it was 26 candles ago, indicating that the price has gone nowhere.
Span B Line Represents A Strong Support And Resistance Level
Span B is the far boundary of the cloud.
It is computed as the midpoint of the 52-period price range, plotted 26 periods ahead:
Span B = (52-period highest high + 52-period lowest low) / 2
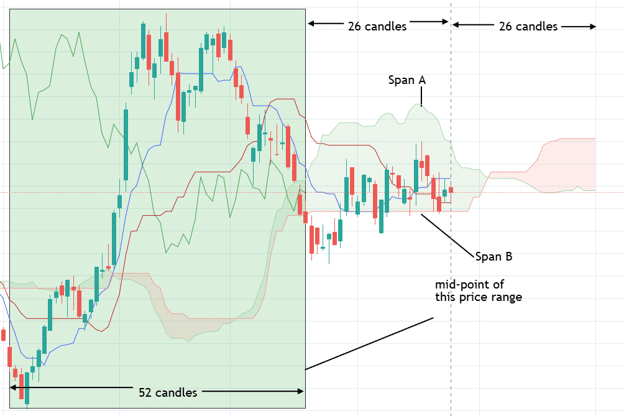
Therefore, a flat Span B line means the price did not make a high or low outside the price range highlighted in green.
Price is inside a range.
The price level of flat Span B is the 50% Fibonacci retracement of the low and high of that range.
Span B tends to be a strong support and resistance level because it uses the longest time period for its calculation, 52 candles.
Span B represents equilibrium, and the price tends toward equilibrium.
Because Span B is plotted 26 periods ahead, traders can see where future support or resistance will be before the price reaches it.
This forward projection is one of the most distinctive features of the Ichimoku system and one that sets it apart from most other technical indicators.
When price approaches a future Span B level, traders can prepare a directional trade or a defined-risk spread positioned around that level.
Kumo Twist
When Span A is above Span B, we have a bullish green cloud.
But when the forward-looking cloud changes color, there is a potential for a reversal….
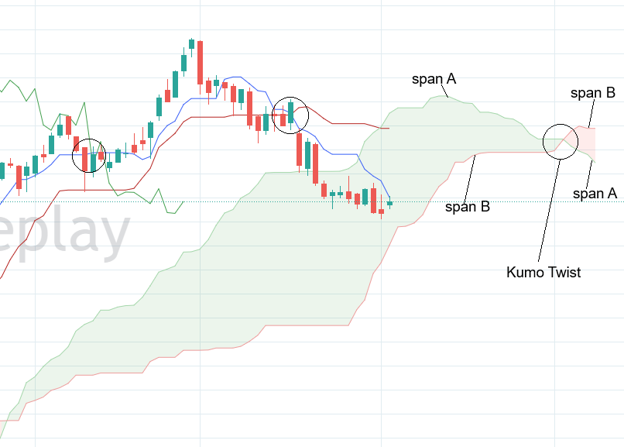
After the twist, the forward-looking cloud has now turned red, with Span B above Span A.
This chart already shows prior bearishness because…
- lagging line crossed below price
- price crossed below the slow-moving average
- fast-moving average crossed slow-moving average
The Kumo twist is particularly useful as a forward-looking warning.
Because the cloud is projected 26 periods into the future, traders can see a color change on the cloud before the price even reaches it.
This gives time to assess whether the existing trend is likely to continue or reverse, and to plan entries or exits accordingly.
A thick cloud at the point of a Kumo twist suggests that the area ahead will offer strong support or resistance, while a thin cloud suggests the transition may be faster and less contested.
Price Crossing Span B From Above Is A Sell Signal
Span B is the far boundary of the cloud and acts as a strong support/resistance barrier.
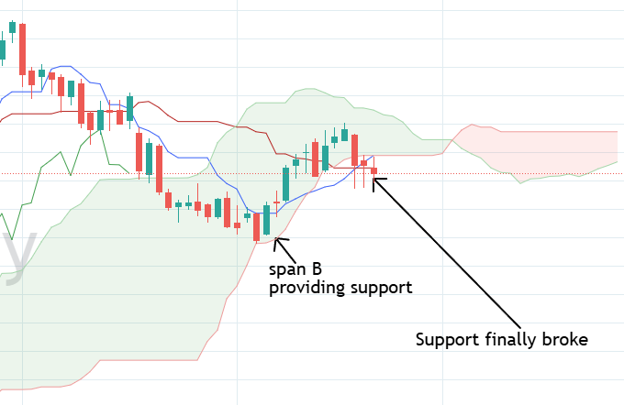
But when the price eventually breaks down through Span B, it signals that the move has significant strength behind it, making it a strong directional signal.
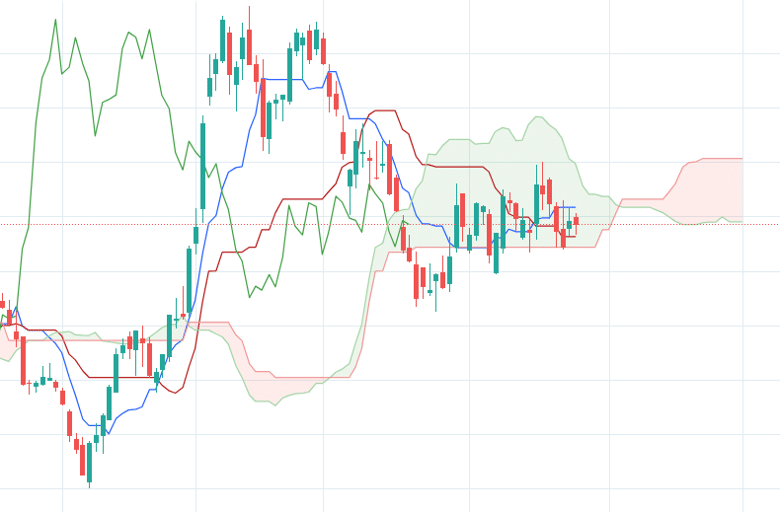
Reversal To The Upside
The following is a bearish chart in which prices entered the cloud…
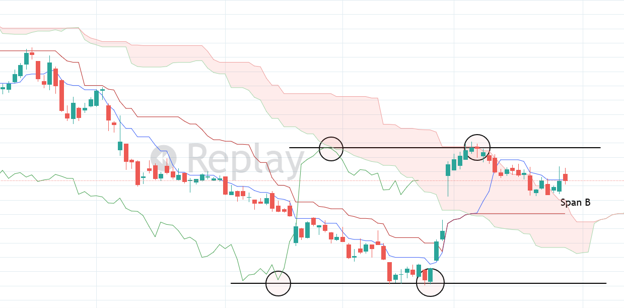
It had a hard time breaking out of the cloud to the upside, because the cloud is thick and because the far boundary of the cloud (Span B) represents strong resistance.
Then, when the price finally broke through the cloud on the upside, it suggests that the price is getting strong bullishness
Note above how the lagging line helps us draw ranges where the price is trapped.
When we see the lagging line and the price break out of that range (as shown below), that suggests bullishness…
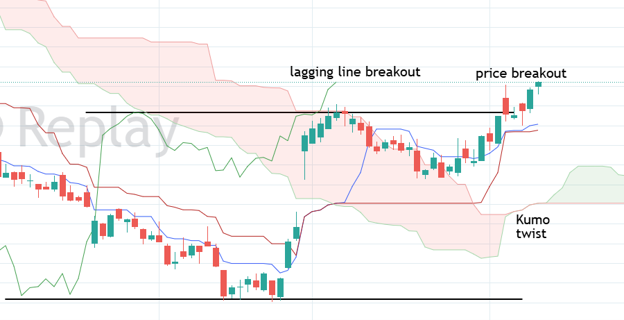
Further evidence of bullishness is that the Kumo twist turned the forward-looking cloud from red to green.
This pattern, where price struggles through a thick cloud before breaking out with conviction, is one of the most reliable setups in the Ichimoku system.
The resistance offered by the cloud absorbs weaker hands; once the price clears it, the move tends to have follow-through.
Traders who missed the initial break often look for a retest of the top of the cloud as a second entry opportunity, since the cloud that previously acted as resistance typically becomes support after the breakout.
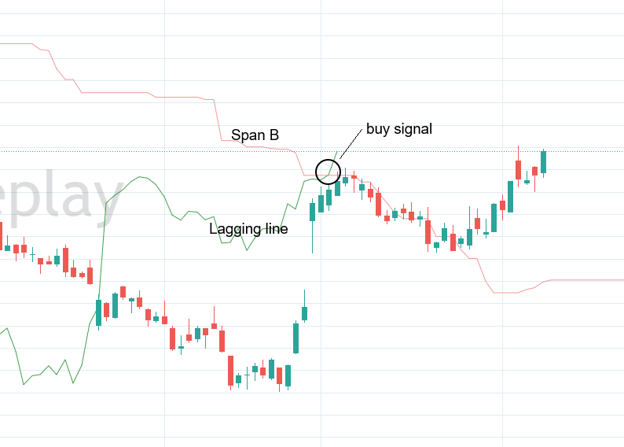
Lagging Line As Confirmation
In the last example, we saw the price break through the cloud first.
And then later, the lagging line also broke through Span B of the cloud.
When the price moves, the lagging line should follow.
The lagging line can be used as confirmation.
Traders who want greater confidence may wait for the lagging line to pierce the cloud before taking the signal.
As such, they may only look at the Lagging Line and Span B crossing as a trading strategy.
The lagging line also makes historical comparisons easy to read on the same chart.
When the lagging line is sitting in open space, with no price candles directly around it, the current price is trading in territory that was not congested 26 periods ago.
That open space acts as a runway, suggesting the current move has room to continue.
Conversely, when the lagging line runs directly into prior price candles, it indicates the current price is entering a congested zone, which may slow or reverse the move.
As with any technical system, the Ichimoku Cloud should inform but not replace a sound trading plan.
Careful position sizing remains essential regardless of how strong the signal appears.
Even when multiple Ichimoku components agree, unexpected news or earnings events can override technical setups.
Treating each trade as having a defined maximum risk and sizing accordingly keeps losses manageable when the system generates a false signal.
Summary
- Price above cloud is bullish.
- Lagging line above price is bullish.
- Fast-moving average crossing below the slow-moving average is a sell signal.
- Price crossing below the slow-moving average is a sell signal.
- Lagging line crossing below price is a sell signal.
- Price piercing through the cloud from above (crossing span B) is a sell signal.
- Lagging line crossing below Span B is a sell signal.
The reverse applies.
When neither applies (for example, when price is within a cloud), do not trade directionally.
The cloud’s slope and thickness are relevant.
Kumo twists foreshadow potential change in trend.
Traders who combine the Ichimoku Cloud with options strategies gain an additional edge: the cloud’s forward projection helps them identify when high probability setups are forming before they materialize, giving more time to plan entries, select strikes, and manage risk in advance rather than reacting after the move.
No single signal should be used in isolation.
Instead, rely on the weight of evidence across multiple signals to determine whether the chart is bullish or bearish, and how strong that conviction is.
If you’re serious about building an income-generating options portfolio:
Options Income Mastery: Learn the complete wheel strategy including covered calls, cash-secured puts, position sizing, and adjustment techniques for consistent monthly cash flow ($397)
The Accelerator Program: Advanced training covering portfolio-level management, multiple income strategies, systematic approaches, and professional risk management techniques for serious traders ($997)
We hope you enjoyed this article on reading the Ichimoku Cloud.
If you have any questions, send an email or leave a comment below.
Trade safe!
Disclaimer: The information above is for educational purposes only and should not be treated as investment advice. The strategy presented would not be suitable for investors who are not familiar with exchange traded options. Any readers interested in this strategy should do their own research and seek advice from a licensed financial adviser.


