


What is VVIX? Well, if the VIX is like the speed of a car cruising down the road, then VVIX is the acceleration. Let’s take a detailed look.
Contents
- What is VIX?
- What are Normal Levels?
- Gauge of Market Volatility
- VVIX as a Leading Indicator
- Car Analogy
- Derivatives
- Indicator of Options Premiums
In short, VVIX is a CBOE (Chicago Board Options Exchange) index that measures the volatility of the VIX.
What is VIX?
To understand VVIX, an investor needs to first understand the VIX, a more commonly watched index.
VIX is the CBOE Market Volatility Index which measures the volatility of the S&P 500 index.
While sometimes referred to as the “Fear Index”, the VIX is probably more accurately be described as the “uncertainty index”.
The more uncertainty, the more willing they are to buy and sell.
When VIX is high, you can say that investors are more desperate to buy and sell, perhaps at prices that they would not buy or sell otherwise in a more calm market.
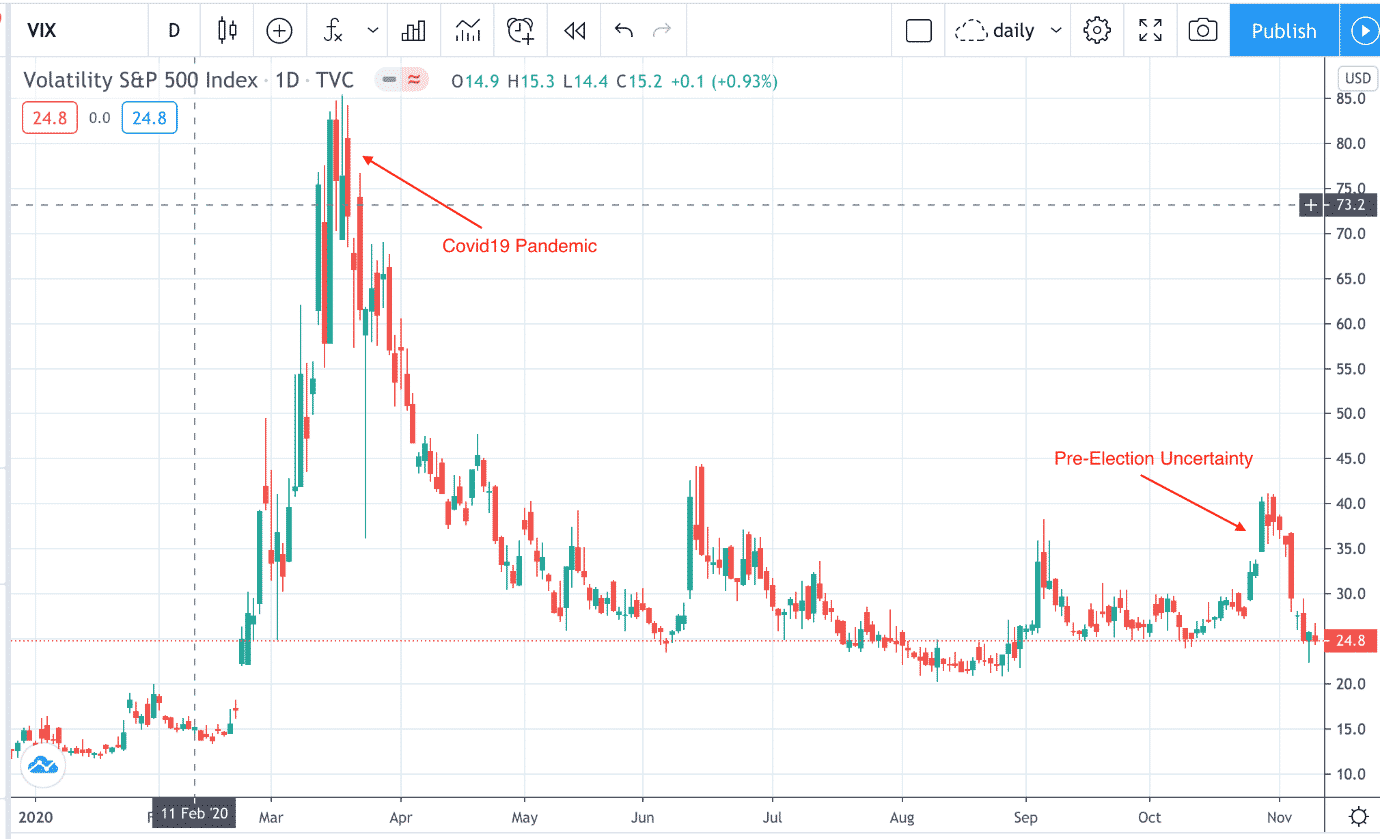
During the Covid19 pandemic market selloff in March 2020, some investors were probably calling their brokers to … “Just sell my positions, I don’t care at what prices.”
Not all upward spikes in the VIX are due to bad news, the period before the 2020 presidential elections had a spike in the VIX due to uncertainty of an event outcome.
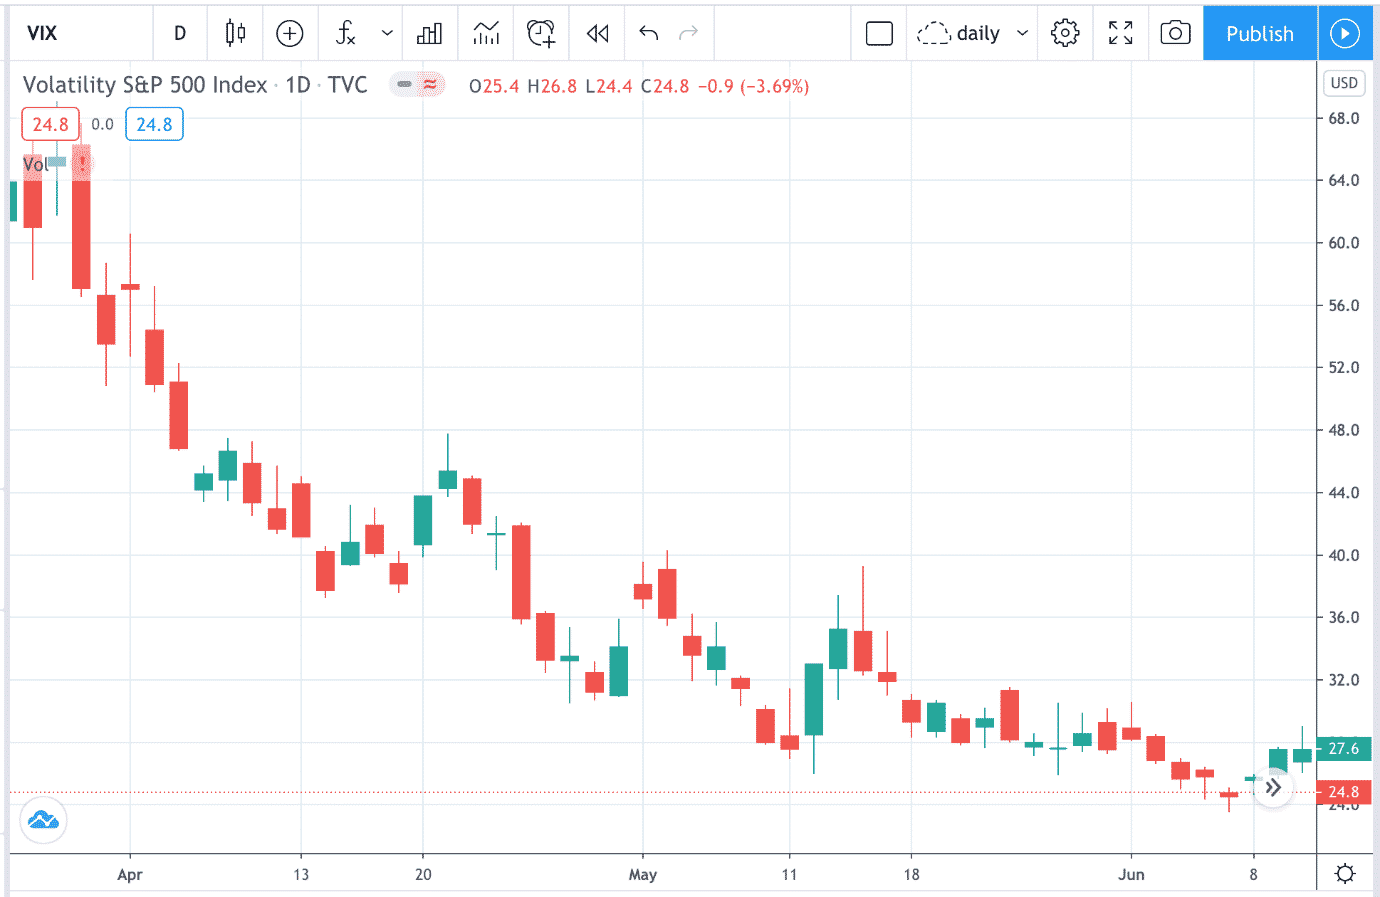
Here is the chart of the VIX during parts of 2020:
And here is the chart of the VVIX during that same time period:
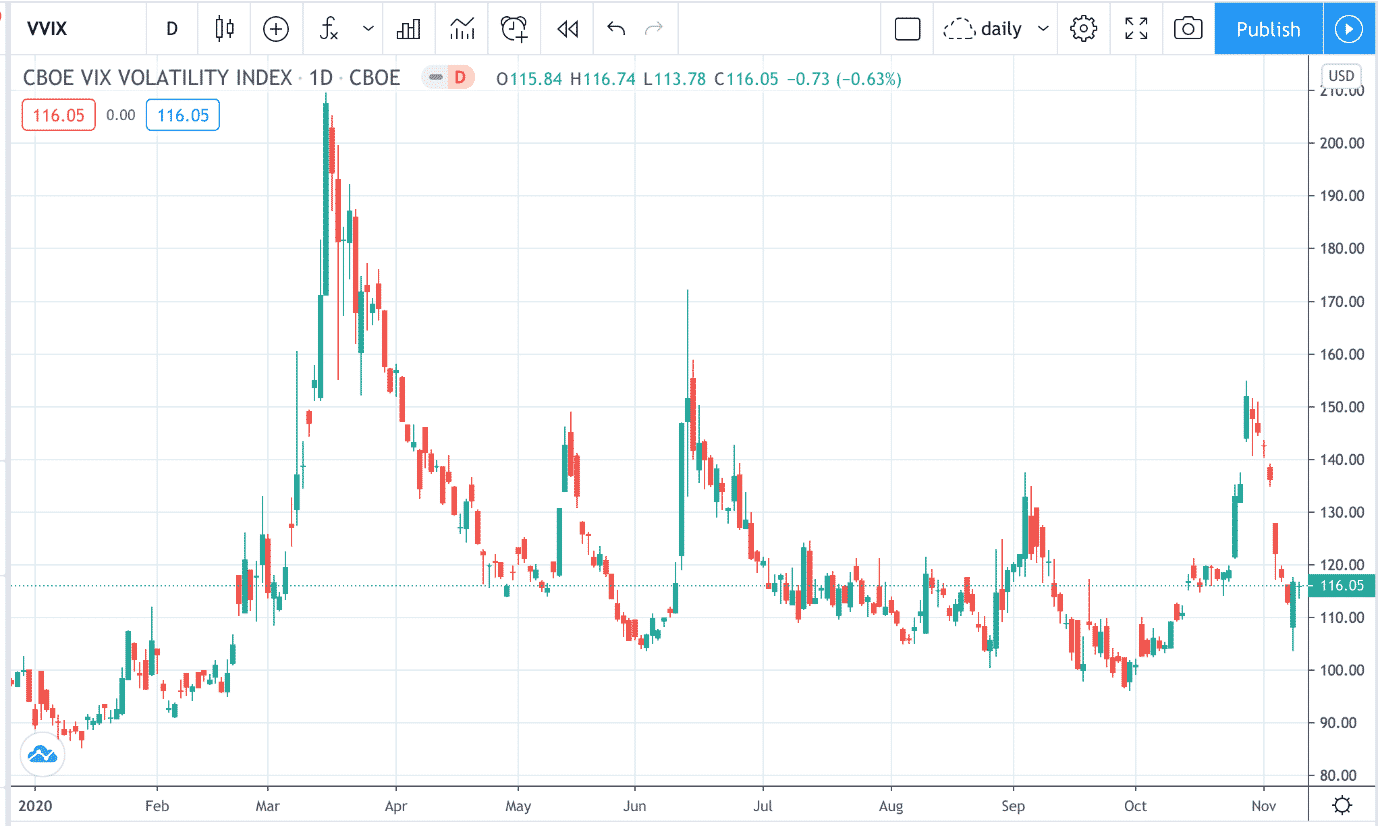
VIX and VVIX are highly correlated.
Like VIX, the VVIX is also mean-reverting, which means that it spikes to high values for a short time and then comes back down to normal levels.
What are Normal Levels?
In prior years, below 18 on the VIX is considered calm market. And below 100 on the VVIX.
Year 2020 showed higher volatility values due to the pandemic. Normal values of that year would be below 25 on the VIX and below 110 on the VVIX.
Gauge of Market Volatility
Investors use the VIX and VVIX values to gauge the market risk.
High values suggest greater direction uncertainty, larger price swings, and also higher options premiums.
Among other indicators, this is one indicator for investors to decide whether to put risk on, take risk off, or to adjust position sizes.
VVIX as a Leading Indicator
Assume an investor is considering to buy the pullback of an uptrend in the SPX on June 10, 2020.
Note the far right candle.
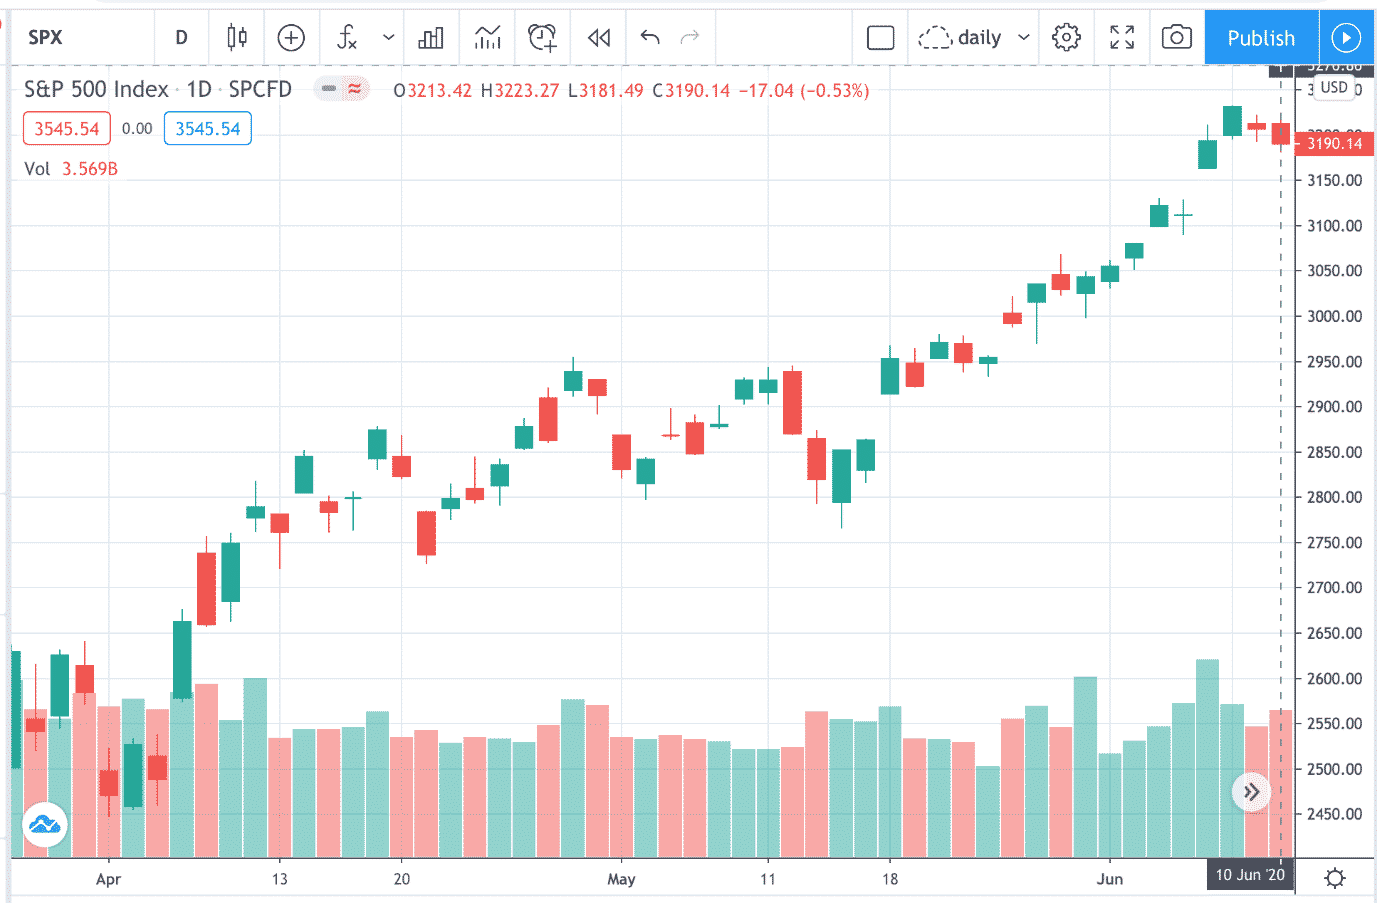
Checking the VVIX, the investor sees a spike higher on that day.
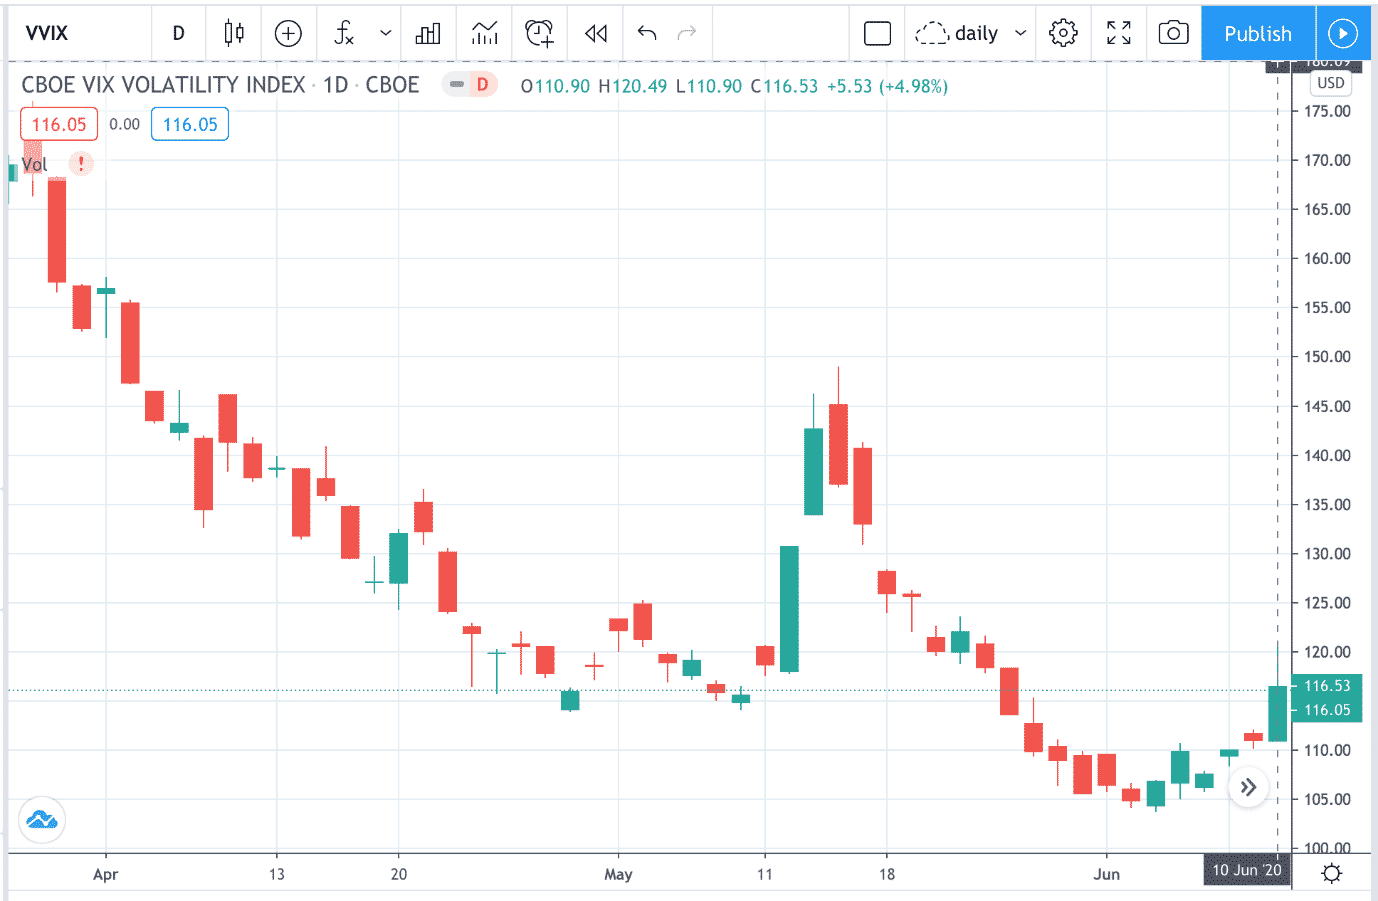
While it is normal for VVIX and VIX to go up on bearish days of the SPX, the investor deems the spike to be abnormally large relative to the change in SPX and decides not to buy the SPX.
Using the VVIX as a leading indicator saved the investor from a gap down on a red candle the next day.
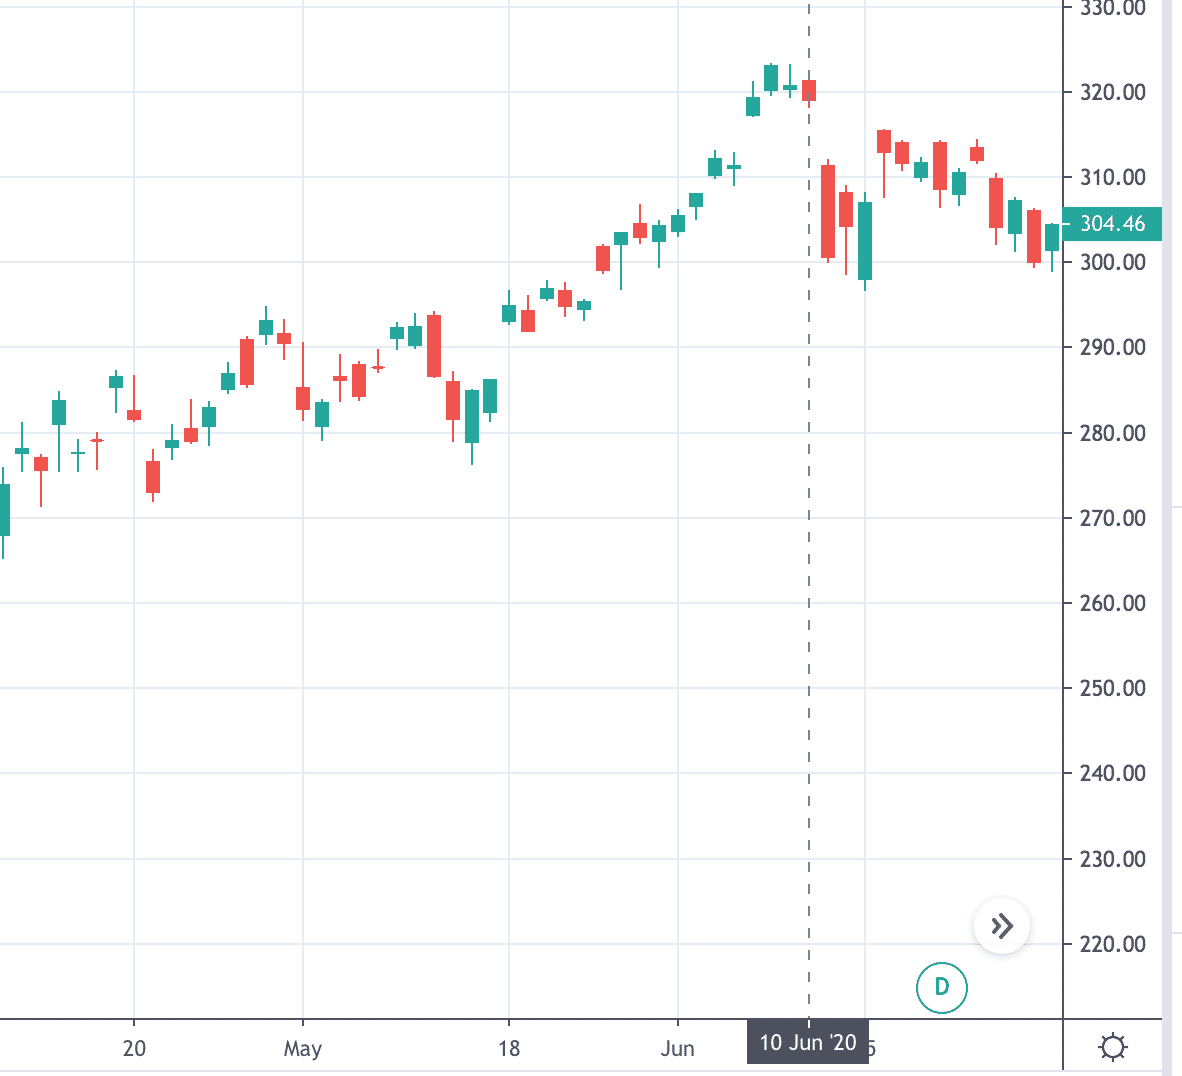
Buying the pullback would have failed.
Some would argue that you can see the same on the VIX.
Maybe. But the spike in the VIX did not look as ominous as the one in the VVIX.
Car Analogy
The VIX is like the speed of a car cruising down the road.
You just know the speed.
You can’t tell if the car is speeding up or slowing down.
For that information, you need to know the car’s acceleration.
VVIX is the acceleration.
Derivatives
In physics of moving objects, we say that acceleration is the derivative of velocity.
Acceleration measures the rate of change of velocity.
In options, gamma is the derivate of delta.
Gamma measures the rate of change of delta.
Similarly, VVIX is the derivate of VIX.
VVIX measures the volatility of the VIX.
And VIX measures the volatility of the S&P 500 index.
To be more precise…
VVIX is based on the option prices of the VIX.
The option prices of the VIX is based on VIX futures.
The VIX futures is based on the VIX value.
The VIX value is based on the option prices of the SPX.
Indicator of Options Premiums
Therefore, when VIX is high, that means option prices of the SPX is high, which means investors want to sell premium on the SPX (such as selling a credit spread, iron condors, etc)
When VIX is low, they might consider buying premium such as calendars on SPX.
And so on.
Similarly, VVIX can be used as an indicator of options premiums on VIX.
When VVIX is high, that means option prices of the VIX is high, which means investors want to sell premium on the VIX (such as selling credit spreads or some other short vega trade on VIX).
When VVIX is low, investors may buy a calendar on VIX, or some other long vega trade on VIX.
For awareness, the VIX cannot be bought and sold.
But options on the VIX can be bought and sold.
And they are quite liquid too.
For investors that trade options on both SPX and VIX.
The VVIX value can decide which of the two to trade.
If VVIX percentile rank is higher than VIX percentile rank, that suggests that VIX options premiums are higher than SPX option premiums.
Hence, do short vega trades on VIX; and long vega trades on SPX.
If VVIX percentile rank is lower than VIX percentile rank, that suggests that SPX options premiums are relatively more expensive than VIX options.
Hence, do short vega trades on SPX; and long vega trades on VIX.
Trade safe!
Disclaimer: The information above is for educational purposes only and should not be treated as investment advice. The strategy presented would not be suitable for investors who are not familiar with exchange traded options. Any readers interested in this strategy should do their own research and seek advice from a licensed financial adviser.


