


Contents
The Shiller PE CAPE ratio, also known as the Shiller PE ratio, was popularised by Professor Robert Shiller from Yale University in 1996 when they presented research to the United States Federal Reserve that suggested that stock prices were at risk as they were rising faster than corporate earnings.
Building on the famed investor Benjamin’s Graham’s work in his 1934 book, Security Analysis, Robert Shiller and his colleague John Campbell published an article in 1988 called “Valuation Ratios and the Long-Run Stock Market Outlook.”
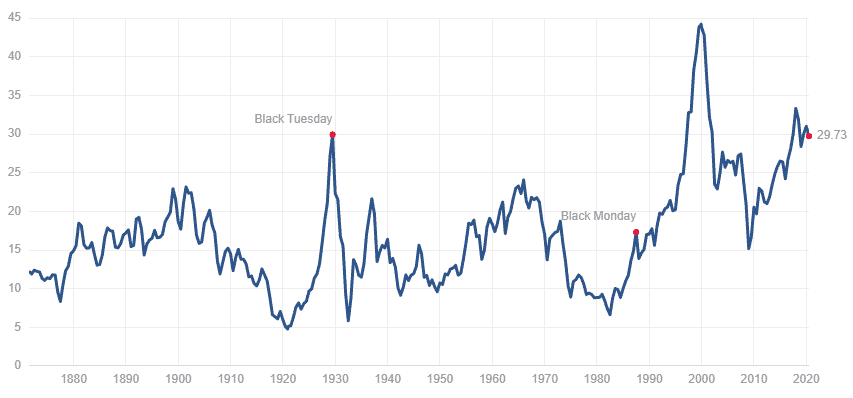
In the article, they used data going back as far as 1872 to determine the high and low points of the CAPE ratio, showing that the ratio hit a record high of 28 just a year earlier, with the only other instance being a similarly high ratio back in 1929.
Based on the elevated CAPE ratio and the history of the market in 1929, Shiller and Campbell predicted that the stock market would fall 40% in the next ten years, which proved remarkably accurate as the market fell 60% in 2008.
The Shiller PE CAPE ratio is not without its critics however, so like all indicators and measures, it should not be relied upon as the sole measure of whether a market is fairly valued.
Understanding the CAPE Ratio
The CAPE ratio stands for cyclically adjusted price-to-earnings ratio and it is used as a way to determine whether the market is fairly valued or over/undervalued.
Before the CAPE ratio became popular, the PE ratio (Price-To-Earnings) was sometimes used to determine if the market was fairly valued.
However, the problem with the PE ratio is that the business cycle can impact a business in such a way as to send a false signal as to whether it is indeed fairly valued or not.
For example, during an economic expansion, companies will generally have higher earnings and profit margins.
Due to the increase in earnings, the PE ratio will fall, making the stock appear to be more attractive.
Since every economic expansion is followed by an economic contraction, it means that at some point earnings will fall, and with it, the price of the stock.
So simply using a PE ratio means that precisely when the stock is at the highest risk of falls (during an economic expansion) the PE ratio will be most attractive.
This dynamic happens in reverse during recessions, where the PE ratio of stocks will be high due to depressed earnings.
In order to avoid the issue of the business cycle impacting prices, the CAPE ratio was created.
The CAPE ratio uses corporate earnings per share (EPS) over a 10-year period, which serves to smooth out any short-term fluctuations in the stock price and provides a more realistic long-term perspective of the value of the stock.
For example, in the first quarter of 2009, as the GFC raged on, the stock market seemed incredibly expensive with the PE of the S&P 500 at an eye-watering 123, well above the long-term average of 15.
However, during this time, the Shiller CAPE ratio was in fact 13.3, the lowest level in decades, correctly signaling that stocks were undervalued.
The Shiller CAPE ratio is calculated using the following formula:
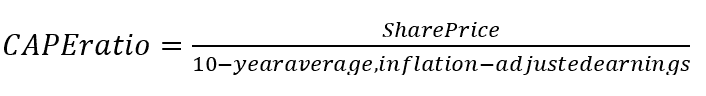 The Shiller CAPE ratio can be used across all stocks, but it is most widely used across broad equity indices such as the S&P 500.
This allows investors to be able to use the Shiller CAPE ratio as a way to factor in whether the overall market is over or undervalued, to provide opportunities for going long or short.
Limitations of the CAPE Ratio
The key limitation of the CAPE ratio is that it is a backward-looking indicator and so it relies on conditions and standards being largely the same.
For example, between 2018 and 2020 a number of major changes were made to the Generally Accepted Accounting Principles (GAAP), which form the accounting principles, standards, and procedures that US public companies must adhere to.
These major changes to the GAAP meant that earnings post the GAAP changes weren’t a like-for-like comparison to earnings that were recorded before the GAAP was changed.
This has resulted in a number of critics saying that the current method of calculating the CAPE ratio is too pessimistic and that different measures for earnings should be used to maintain some measure of consistency.
In response to this, 2016 Jeremy Siegel published an article in the Financial Analysts Journal, titled The Shiller CAPE Ratio: A New Look.
He found that by applying a consistent measure of earnings, in this case, the earnings calculated by the national income economists at the Bureau of Economic Analysis, found that this suggested that stock returns will be higher in the future, despite the regular CAPE ratio saying otherwise.
Conclusion
Popularised by Robert Shiller in 1996, the Shiller PE CAPE ratio uses corporate earnings per share (EPS) over a 10-year period.
By doing so, it smooths out any short-term fluctuations in stock prices that can occur as a result of regular parts of the economic cycle, such as when the economy is in a recession.
This avoids the issues inherent to alternate measures such as the PE ratio, which would show a really high value during recessions due to depressed earnings.
Like all indicators, there are limitations to the Shiller PE CAPE ratio, notably the fact that it is a backward-looking indicator.
This can present issues due to changing rules and frameworks, such as the changes to GAAP standards.
As a result, like all indicators, it should not be solely relied upon for making investment decisions but instead should form part of a comprehensive risk and portfolio management strategy.
Trade safe!
Disclaimer: The information above is for educational purposes only and should not be treated as investment advice. The strategy presented would not be suitable for investors who are not familiar with exchange traded options. Any readers interested in this strategy should do their own research and seek advice from a licensed financial adviser.


