


The Relative Strength Index (RSI) is one of the most popular technical analysis tools out there.
One of its most popular setups is the RSI Divergence trade, and in this article, we’ll break down exactly what RSI divergence is, why it’s useful for traders, and, most importantly, how to identify and profit from divergences on your charts.
Whether you’re a novice or a seasoned investor, you’re sure to pick up some helpful tips.
Contents
What Is RSI Divergence?
An RSI divergence occurs when there is a difference between the direction of the underlying instrument’s price and the RSI indicator’s direction.
This indicates a potential reversal in the current trend and can be a powerful tool for traders.
There are two types of RSI divergences: bullish and bearish.
The RSI is a momentum oscillator that measures the speed and change of price movements over time.
It oscillates between 0 and 100, with readings above 70 and below 30 considered extreme readings.
These readings are overbought and oversold, respectively.
The RSI value displayed is calculated using a formula that compares the average gains and losses over a specified period, and it can provide traders with valuable insights into the Momentum of a trend and where it may start to reverse.
Types Of RSI Divergence
Now that we have a basic understanding of the RSI and its calculations let’s look at the actual divergences.
Bullish RSI Divergence – A bullish RSI divergence occurs when the price of an asset forms a lower low while the RSI indicator forms a higher low. This suggests that the selling pressure is weakening, and a bullish reversal may be on the horizon.
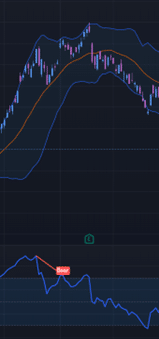
Bearish RSI Divergence – A bearish RSI divergence happens when the opposite of a bullish divergence does. The price of an asset forms a higher high while the RSI indicator forms a lower high, showing that there is potential for a reversal or change to trend down. Look at the image to the right as an example: The price continues to increase while the RSI values continue to make lower highs.
How The RSI Divergence Indicator Helps In Trading
Now that we have a general understanding of the RSI, the types of divergences, and how to see them. Let’s take a look at a few different uses for them.
Early Trend Change Signal:
RSI divergences often happen slightly earlier than the actual trend change.
Watching for a divergence to appear can be a “canary in a coal mine” that the current trend may end.
This can be incredibly beneficial to traders. Utilization of this early warning signal could allow traders to start to close an existing position or look for the entry of a new one.
Trade Entry Points:
The second way many traders use the RSI divergence is as an entry signal.
As a stock starts to enter a level that a trader would be looking to buy or sell at, they can use the divergence forming as the signal to execute.
This can also help keep risk limited because as soon as the divergence disappears and the RSI continues in the direction of the underlying price, the trade can exit the trade.
Trade Exit Signal:
The final way is to use it as an exit signal.
As mentioned above, if a trader is in a position and an opposite divergence occurs, it could be time to start looking for an exit plan.
Whether adjusting stops or lightening a position’s exposure, it can help save a trader from unnecessary drawdowns.
Trade Entry Breakdown
Now that we know how to use the RSI divergence, let’s take a step-by-step approach to using them to enter a position.
1. Identify RSI Divergence: The first step is to identify the divergence. Scan your charts for names that display the divergences above.
2. Create a Watchlist: Take these names and create a watchlist so you can start scanning them daily.
3. Confirm with Other Indicators: RSI Divergence should not be the only entrance criterion. Scan through the watchlist you created above to look for names showing other indicators/setups you use.
4. Set Entry Criteria: The last step is to set the entry criteria for the trade. Ideally, this would be a specific price level or a breakout of a price pattern you use as part of your trade plan. Another possibility is to use the divergence resolution (when the price finally matches the reading) as the entrance.
Keeping these four steps handy will help mitigate the false signals you get from the RSI Divergence.
The Divergence And Options
Options are an incredibly powerful tool to use alongside the RSI Divergence for several reasons. First, you can buy as much time as you would like, and your risk is always fixed.
As we discussed above, the divergence is often an early warning sign for a trend change, making timing your entry difficult if using equities.
Additionally, if you are wrong in the trade, you now have to worry about where your stop is, if the divergence is truly ending or deepening, and how much size should be allocated to the position.
An option alleviates almost all of this concern.
First, buying time allows you to be wrong with the fixed risk of a long option.
This gives all of the upside potential and severely limits the down.
If spreads are more your trading style, then using Verticals, Calendars, and Ratios can help you purchase directionality without worrying about the option’s time value.
While this severely limits the upside potential, it also removes almost all the other variables.
Tips for Trading RSI Divergence Patterns
Seeing a divergence appear can be tricky, but with some help, you can become proficient at spotting them. Here are some additional tips and tricks for spotting them.
Practice – Like anything, practice makes perfect. One great way to practice is to wait for the market to close to review historical data and look for divergences. The more you do it, the better you get. Plus, it can show you how your favorite names react to them.
Keep an Eye on Market Conditions – Market conditions and news are always important to keep an eye on, and this is no different. If you are viewing a divergence on your favorite stock but they have earnings in 3 days, it may be wise to wait until after the earnings are released to enter.
Manage Risk -Always prioritize risk management, but this is especially important with divergences since they can be tricky to spot. Using tight risk management will help keep you out of trouble if you are wrong on a divergence or price spikes against you.
Divergence Indicators – Programs like TrendSpider have automated dedication algorithms that can help speed up the detection and accuracy of spotting divergences.
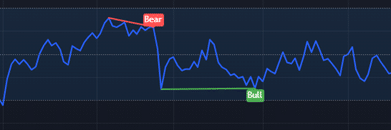
Next are actual indicators like the one being utilized in TradingView in the image on the right. This RSI Divergence Indicator automatically marks divergences on the chart so that you don’t have to guess what you see. Many brokers and platforms like ThinkorSwim and TradeStation have a similar version of this, so you can utilize it in your daily trading.
Conclusion
RSI Divergence is a powerful indicator providing valuable insights into potential trend reversals.
By understanding the concept of RSI Divergence, utilizing it for trade entry signals, and knowing when to close a trade, traders can enhance their decision-making process and increase their chances of success.
Remember to always confirm RSI Divergence with other indicators, set specific entry and exit criteria, and stay flexible in your approach.
With practice and experience, you can unlock the full potential of RSI Divergence and take your trading to new heights.
We hope you enjoyed this article on the RSI divergence indicator.
If you have any questions, please send an email or leave a comment below.
Trade safe!
Disclaimer: The information above is for educational purposes only and should not be treated as investment advice. The strategy presented would not be suitable for investors who are not familiar with exchange traded options. Any readers interested in this strategy should do their own research and seek advice from a licensed financial adviser.


