

Contents
- Starting the Rhino on SPX
- Scaling up
- Profit Target And Stop Loss
- Adding Call Broken Wing Butterfly Hedge
- Profit Target Reached
In a previous post, we’ve looked at the Rhino option strategy on the RUT and showed an example of using upside call calendars as hedges to flatten the T+0 line as price moves up.
In this post, we will look at an alternative which is to use a broken wing butterfly as hedge instead of the calendars.
The difference being that calendars are long vega and will be of an extra benefit if implied volatility increases.
Broken-wing butterfly are short vega and will be of an extra benefit if implied volatility decreases.
This time, let’s do the Rhino strategy on SPX.
Seeing a second example on a different index will serve as a good review of the Rhino trade.
If you are new to these trades, first go through our previous example which has greater explanation.
We’ll move a bit faster in this second example.
Starting the Rhino on SPX
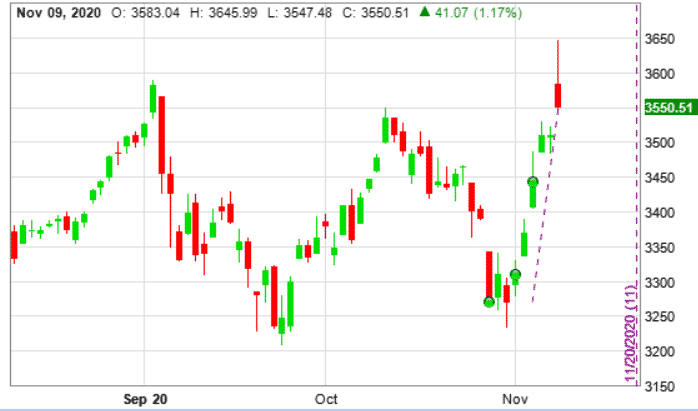
On October 28, 2020, SPX dropped down to 3271 and approached previous support of 3200.
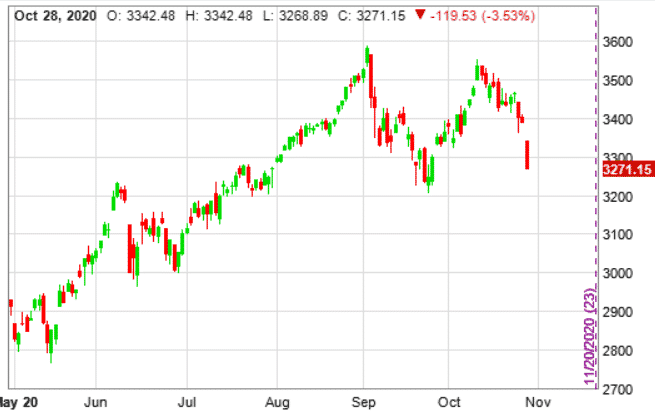
An investor who believes that SPX will consolidate around this level and not drop further decides to put on the Rhino trade at half size to start.
Buy 3 SPX Jan 15 – $3150 put @ $153.75
Sell 6 SPX Jan 15 – $3230 put @ $181.05
Buy 3 SPX Jan 15 – $3300 put @ $208.30
Credit received: $15
Max risk on downside: $2985
These are 70/80 broken-wing put butterflies with expiration 79 days out.
The wing ratio can be adjusted depending on the put call skew at the time.
And the butterflies can be for a credit or a debit.
In this case, it ended up with a very small credit.
The goal is to have the T+0 line very flat in the payoff diagram.
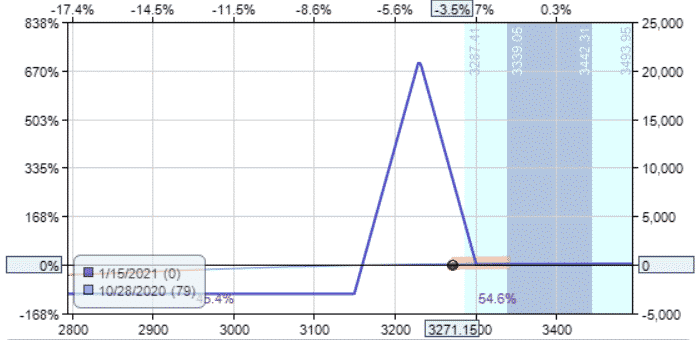
The T+0 line is barely visible here since it is so flat and laying right on top of the horizontal axis.
Scaling up
On November 2nd, SPX has moved past the upper strike.
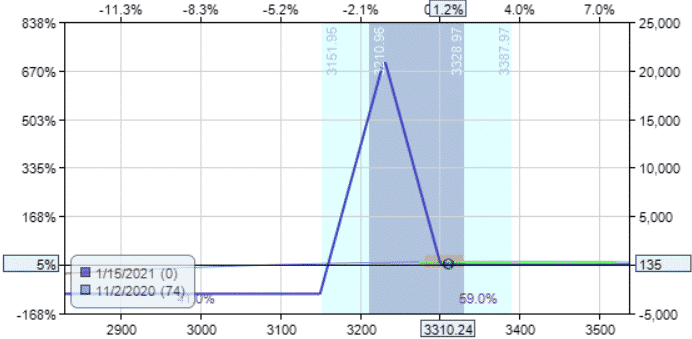
The investor scales up to full size by adding 3 more butterflies:
Buy 3 SPX Jan 15 – $3190 put @ $133.15
Sell 6 SPX Jan 15 – $3270 put @ $159.25
Buy 3 SPX Jan 15 – $3340 put @ $185.80
Debit paid: $135
The maximum risk on the downside for the full position is $6120.
Profit Target And Stop Loss
The take profit level of 10% will be $612.
If the investor does not achieve this profit within half the duration of the trade, the investor will reduce the profit target by 20% — down to $490.
Ideally, the investor would like to exit the trade before three weeks to expiration.
If still in the trade by then, the investor will reduce the profit target further to 40% of the original target — down to $245.
The stop loss level will be 15% of max risk — $918 in this case.
Adding Call Broken Wing Butterfly Hedge
On November 4th, SPX really moved up.
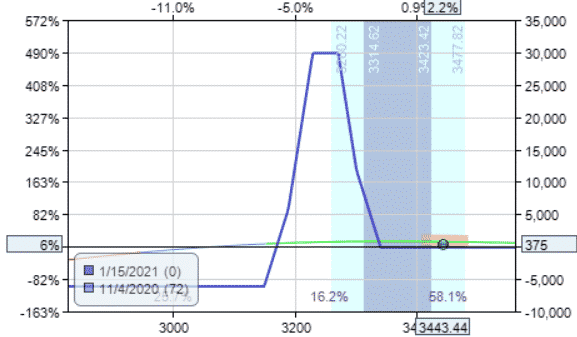
Time to add the upside call broken-wing butterfly hedge:
Buy 1 SPX Jan 15 – $3390 call @ $173.15
Sell 2 SPX Jan 15 – $3470 call @ $123.45
Buy 1 SPX Jan 15 – $3520 call @ $96.20
Debit paid: $2245
This hedge butterfly by itself should look like this.
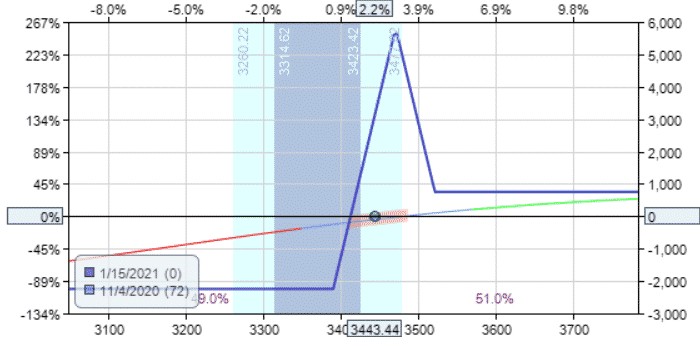
The body of the butterfly is positioned above the price. Hence the use of calls.
The lower strike is below the price.
The lower wing width is 80 points, the same as the lower wing width of the core Rhino butterfly.
The upper wing width is then selected so that this butterfly hedge has no risk on the upside.
The payoff graph of the entire Rhino position looks like this afterwards the hedge is applied:

It looks like the two horns of a rhino.
Profit Target Reached
On November 9th, investor closes the entire trade for a profit of $625 with the payoff graph looking like this at the time.
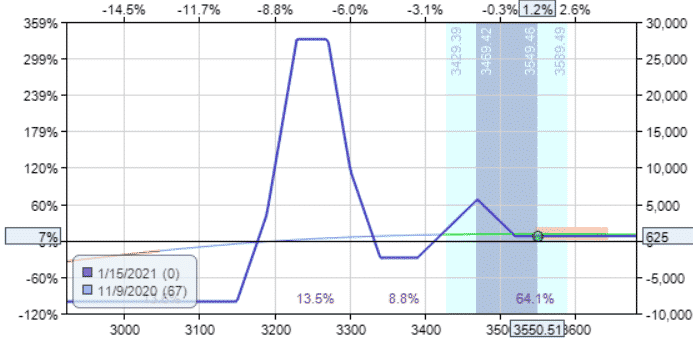
The investor was still able to profit when the price of SPX rallied away from the initial position so strongly.
Part of the reason was that the volatility was still dropping after November 4th as indicated by the VIX…
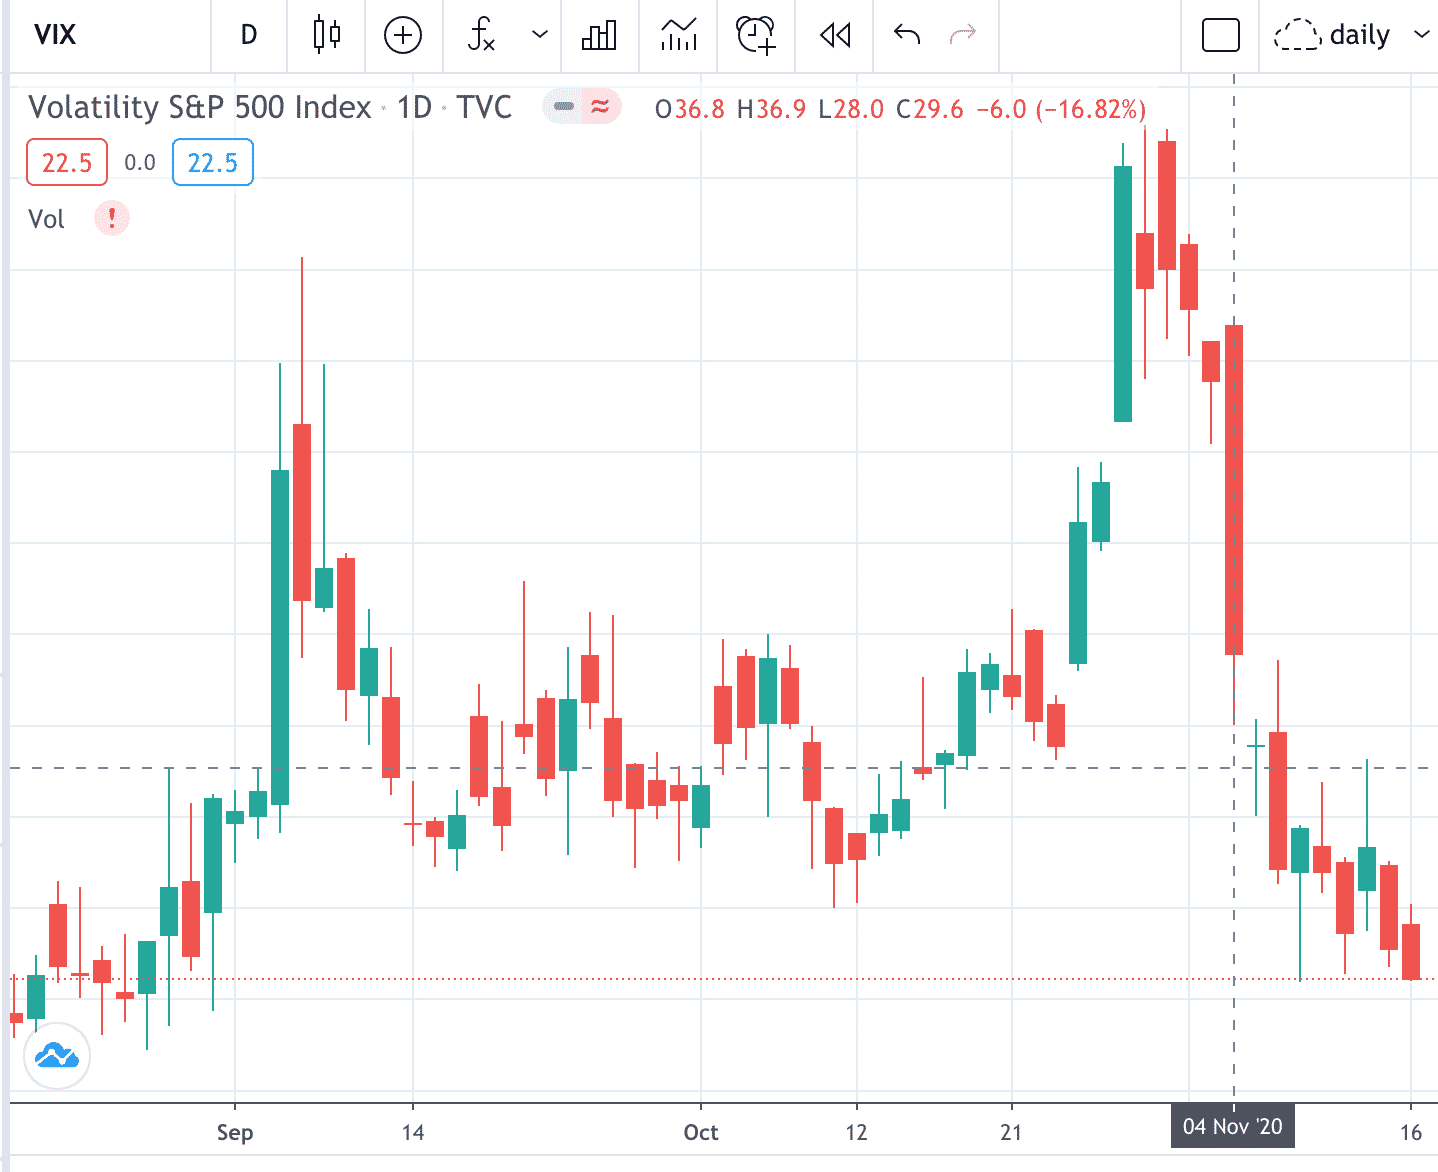
Because volatility often will decrease as price increases, upside call butterflies can be helpful.
Call side butterflies benefit from a fall in volatility.
Call side calendar benefits from a rise in volatility.
An investor can choose either, or a combination of both, or swap them mid-trade.
This is the art of trading the Rhino strategy.
Trade safe!
Disclaimer: The information above is for educational purposes only and should not be treated as investment advice. The strategy presented would not be suitable for investors who are not familiar with exchange traded options. Any readers interested in this strategy should do their own research and seek advice from a licensed financial adviser.


I absolutely love this strategy. Thanks for doing this!
Calendars are neither long or short vega. Depends on IV term structure and how that changes. If the front month IV increases more than the back month then that is going to hurt the calendar.
Yes that is true. Generally speaking, with a standard set up, Calendars are positive vega.