


Real estate income trusts have been around since the 1960s. They were started, and are currently largely originating from, the USA. Because of these factors, we have a relatively long investment history to look at when we’re examining the historical returns of the sector.
Comparing the performance of REITs to a benchmark is the easiest way to examine the returns of the sector and gives us something to compare them to.
The Russell 3000 Index (Russell 3000) is an index that is weighted by market capitalization. It acts as a benchmark to the US stock market. The Standard and Poor’s 500 Index (S&P 500) is a weighted index and is considered a leading indicator of the US stock market. The FTSE NAREIT All Equity REIT Index (NAREIT All Equity) holds all the US equity REITs, except for Timber REITs and Infrastructure REITs. It is adjusted for market capitalization as well. The Dow Jones Wilshire REIT Index measures publicly traded US REITs.
Ultimate Guide to the Stock Repair Strategy
From December 31, 1978 to March 31, 2016, the Russell 3000 averaged an annual return of 11.64%. Comparatively, the NAREIT All Equity average annual returns are 12.87% over the same period.
While REIT investment returns consistently compare favorably to stock market returns over the long-term, the short-term returns can be less dependable. In 17 of the last 25 years, the NAREIT All Equity Index has outperformed the S&P 500.
It’s not an entirely rosy picture though, when REIT performance is bad, it can be really bad. The Dow Jones Wilshire REIT Index lost half of it’s value between 2007 and 2008. In 2007 the value of the index dropped by 17.6%. 2008 made 2007 look good. That year, the index dropped by a further 39.2%. Over the same two years, the S&P 500 saw gains of 5.5% in 2007 and saw losses of 37% in 2008.
If, on January 1, 2007, an investor had invested $100 in a S&P 500 Index Fund that mirrored the index exactly, they would have $66.45 in their investment account on December 31, 2008.
If, on January 1, 2007, an investor had invested $100 in the NAREIT All REIT Index that mirrored the index exactly, they would have $50.10 in their investment account on December 31, 2008.
Over time, the performance of publicly traded REITs has come to mirror the performance of the stock market in general. When the economy is expanding, rents typically rise. This leads to higher revenues to the REIT, which leads to higher distributions to investors, which leads to appreciating share prices. When the economy is contracting, commercial rents tend to fall as spaces come available and stay on the market for a longer period. This leads to lower revenues to the REIT, which leads to lower distributions to investors. The lower distributions spur investors into looking for higher rates of return and puts downward pressure on the share price of REITs.
REIT Subsectors
Equity REITs in general in 2016 returned 8.63% in 2016. The REIT industry can be subdivided into more focused sectors. Returns in each sector can vary widely from the industry taken as a whole. The usual breakdown of sectors within the REIT industry are:
Industrial REITs – These REITs focus on industrial facilities such as warehouses, and distribution centers. They play a significant role in e-commerce as they provide the buildings from which the industry houses and ships their products. In 2016, the average return of a REIT focused on this sector was 30.72%.
Office REITs – These REITs focus on providing office space. They can be focused on either a type of market (high rise office buildings, office parks, etc.) or on a class of tenants (government offices, technology based offices, etc.). In 2016, the average return of a REIT focused on this sector was 13.17%.
Join the 5 Day Options Trading Bootcamp.
Retail REITs – focus on providing retail space. Similar to Office REITs, Retail REITs can focus on more specific areas of investment like shopping malls, regional malls, or free-standing stores. In 2016, Retail REITs returned an average of 0.95%. Interestingly, there was a wide range of returns based on the area of investment that the REIT focused on. Shopping malls returned 3.68%, regional malls took a loss of 5.2%, and free-standing stores posted an average gain of 17.02%. Because regional malls was a larger component of the industry, even though some significant returns could be found in REITs focusing on free-standing stores, the Retail REIT sector in general took a beating.
Residential REITs – focus on providing housing. This area too, can be further split into areas of investment. Managing apartments, manufacturing homes, and building single family homes are quite different activities and can have a large variance in return rates. Residential REITs in general returned 4.45% in 2016. When we classify the REITs further, REITs focusing on apartments returned 2.86%, manufactured homes had a return of 14.15%, and ones that focused on single family homes gave investors a 26.65% boost to their portfolio.
Diversified REITs – invest in a mix of classes. In 2016, they returned 10.27%.
Lodging REITs – focus on providing overnight stays for guests. Think of hotels and resorts in this area of REIT investment. In 2016, they posted returns of 24.34% on average.
Healthcare REITs – invest in buildings that house healthcare ventures. These could be things like hospitals, nursing homes, clinics, etc. In 2016, they returned an average of 6.41% to investors.
Self-storage REITs – provide storage rental units to their customers. The largest self-storage REIT is Public Storage. In 2016, self-storage sector produced returns of 8.14%.
Timberland REITs – are focused on wood and wood products. They can generate revenue from timber operations, the manufacture of wood products, or the valuable parts of land under timberlands (the physical real estate or natural resource found underground). Average returns in 2016 were 8.28%.
Infrastructure REITs – provide the physical infrastructure for varying industries. Examples could include the towers for wireless networks, pipelines for energy companies, or fibre cables for technology providers. 2016 returns averaged 10.04%.
Data Center REITs – exist to provide safe data storage to their clients. They invest in data centers that house servers and the products and services that keep them safe. In 2016, they posted average returns of 26.41%.
Specialty REITs – is a subsector of the REIT industry that captures any type of REIT investment that isn’t accurately reflected by the above 11 subsectors. Investments can include farm land, movie theaters, casinos, etc. The specific specialty REIT will likely be focused on one area of investment. Average returns for 2016 were 19.95%.
As you can see, REIT performance can vary widely across subsectors because economic impacts are felt unevenly across subsectors. An expanding economy typically means that the retail sector will be doing well. Trends away from bricks and mortar retailing and to e-commerce boost returns in the industrial REIT subsector, and put downward pressure on retail REITs. As we see regional malls struggling, it would obviously put pressure on revenues generated by REITs focusing on this area.
At other times, and probably in the future as well, economic and lifestyle trends boost the returns of different subsectors at the expense of others.
Time periods:
Although around since the 1960’s, the performance of REITs has only been tracked closely since the mid-1970’s. Long-term returns have been strong relative to the performance of the stock market in general. From 1975 through 2007 their average annual return was 16.7%. From 1975 through 2014, it was 14.1%. Pretty impressive considering that 2007 and 2008 were horrible years for REIT performance. Recall that the Dow Jones Wilshire REIT Index lost around half of it’s value from 2007 to 2008. Consistent long-term returns can lead you to believe that they are a stable investment to add to your portfolio. They are not. As a sector, REIT returns can have wild short-term fluctuations.
The FTSE Nareit All REIT Index has been tracking the industry since 1972. It picks up losses, in absolute dollars, in 1973, 1974, 1978, 1987, 1989, 1990, 1998, 1999, 2007, and 2008. Every other year has gains in absolute dollars.
As a note of caution, the magnitude of gains and losses has a wide swing. The index shows a loss of 42.23% in 1974. In 1976, just two years later, the index posted a gain of 48.97%. That volatility has continued historically. In 2003 the index showed a gain of 38.47%. Five years later, in 2008, the index showed a loss of 37.74%. The largest single year gain since 1972 occurred in 1976.
Comparing that to the performance of the stock market through the S&P 500 Index, the broader market had losses in absolute dollars in 1973, 1974, 1977, 1981, 1990, 2000, 2001, 2002, and 2008. As you can see, there is a significant degree of correlation between years of losses between REITs and the broader market.
Looking at the magnitude of gains and losses, in 1974, the S&P 500 Index showed a loss of 25.90%. Two years later, in 1976, the gains were 23.83%. Looking at 2003 and 2008, the index showed a gain of 28.36% and a loss of 36.55% respectively. Since 1972, the largest single year gain happened in 1995 at 37.2%. The largest single year decline, in that time, happened in 2008. While there is a correlation in performance on a year to year basis, the magnitude of gains and losses is certainly larger when we’re looking at REITs versus the broader market.
Here is the raw annual data comparing the returns of the S&P 500 Index and the Nareit All REIT Index since 1972.
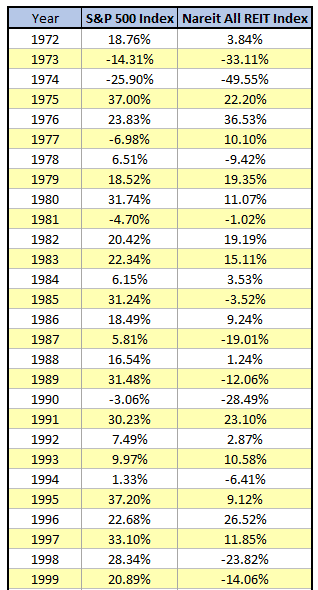
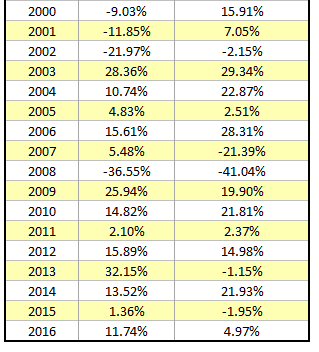
The data shows that REITs in general have a less consistent return than the stock market in general, but that over time, they have outperformed the market.
Factors that drive REIT performance
In general, the same economic factors that propel the broader stock market will impact the performance of REITs. An expanding economy, job growth, and investment by actors within the economy will lead to growth of both. A contracting economy, decline in the employment level, and reduced investment will put downward pressure on REIT performance.
Interest rate increases do tend to have a negative impact on REITs because they do finance much of their investment. Individual REITs can feel that pinch more significantly if they are holding a significant amount of debt. The effect of an increasing interest rate can be mitigated somewhat by a rise in demand for their products. If increased rates make home ownership more unaffordable for people, there could be increased demand for units in apartment buildings. Additionally, economic growth can offset the negative impacts of increased interest rates. If demand for commercial property is growing, the increased rates can be priced in to rental rates.
Demographic trends can have a significant long-term impact on the performance of REITs. We live in an ageing society. As society gets older, the demand for products and services will change. REITs that invest in property that will increasingly get used by baby boomers as they age and retire (health care, self-storage, lodging, etc.) will have upward pressure on their revenue levels as well as their shar
How do you evaluate REITs?
Funds from operation (FFO) is an important measure in the REIT world. Earnings per share or price to earnings measures are less significant to REITs than they would be to traditional shares because they capture depreciation in the ratios. REITs book a depreciation expense, but, as a practical matter, the physical property usually does not decline in price. Because they are not investing in a big way in equipment that declines in value over time, a depreciation expense is less significant to a REIT. Less significant, but not irrelevant. The REIT will invest in some equipment that will depreciate over time (think of a residential REIT buying a new boiler or air conditioning unit for a building). For that reason, an adjusted funds from operation (AFFO) measure is used. Effectively, it takes net operating profit, adds back in depreciation (less the depreciation of assets that will get used up).
Like stocks, the value of a REIT is based on both the current situation as well as the expected performance of the investment. All things being equal, a stock that takes a smaller loss per share than the market expects will rise in price. Similarly, a stock that has lower earnings per share than the market expects can decline in price.
REITs are a total return vehicle. An investor that has capital tied up in REITs will hope to see both a solid dividend stream and capital appreciation. AFFO will help an investor determine a likely dividend payout. Additionally, it can be used to look at yield (AFFO/price) to compare the REIT to other ones.
Trade safe!
Disclaimer: The information above is for educational purposes only and should not be treated as investment advice. The strategy presented would not be suitable for investors who are not familiar with exchange traded options. Any readers interested in this strategy should do their own research and seek advice from a licensed financial adviser.


