


A lot has been written about the Trump’s victory and the stock market lately, so I’m not going to rehash all of that here. What I am going to do is outline some of the bullish and bearish arguments concerning the market going forward.
Keep in mind you should do your own due diligence and always contact your financial adviser before making any investment decisions.
BULLISH CASE
This should all be pretty obvious, the market has decisively broken out to new highs and is seemingly powering higher every day.
Purely in terms of price action, you can argue that this looks incredibly bullish.
I posted some charts earlier in the week. $CS was +13.7% for the week, $TWTR +9.5%, $CSCO +2.5%, $EEM +2.5% and $FB +3.8%.
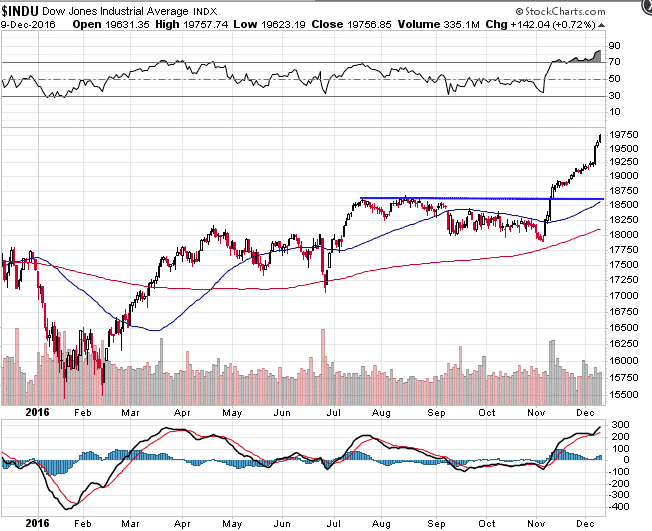
The Dow Jones Index has had an awesome move since breaking out.
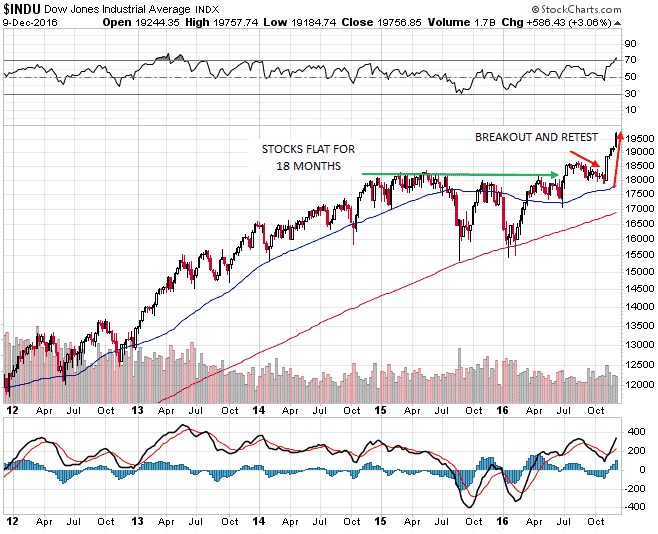
A lot of people might point to the argument that “we haven’t had a bear market since 2009”. Well, I think you can argue that statement is false, or at least misleading. Between late 2014 and mid 2016, stocks basically went no where and had two very large corrections. One of those corrections came within a whisker of the technical definition of a bear market.
Although the indexes never entered an official bear market, many, many individual stocks did with some down over 50%. It was a stealth bear market if you like.
In July of this year, indexes tentatively broke out to all-time highs, then retraced to test that breakout level. The fact the we have bounced and rallied hard off that retest level is INCREDIBLY BULLISH. This chart is almost textbook in it’s beauty.
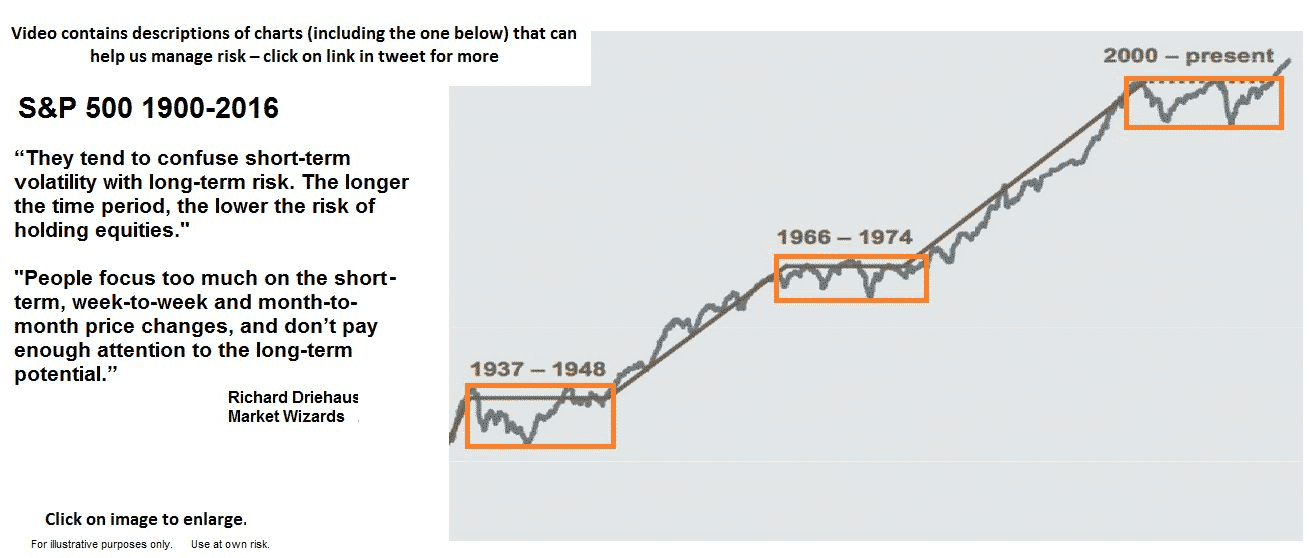
The next chart I want to share is this chart from Twitter care of Chris Ciovacco. Since 2000, we’ve gone down, up, down and back up, and until recently had basically gone no where thanks to two massive bear markets. Possibly two of the worst bear markets on record I might add.
It’s no wonder some have been slow to embrace this rally. Investors have been severely scarred thanks to the last 16 years. That’s an entire generation of investors.
As you can see, stocks have broken out of this 16 year consolidation box. Again, this is incredibly bullish. Taking a long term view, look at what happened the last two times we broke out of a decade long consolidation. Kapow!
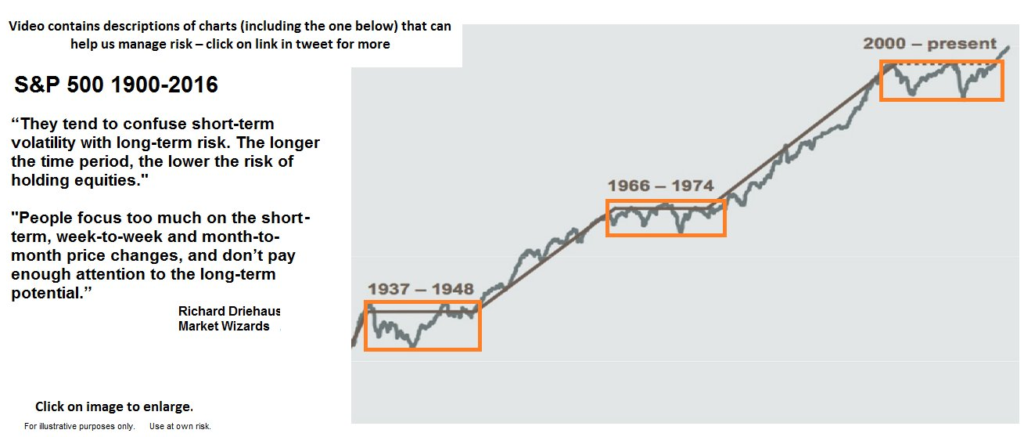
Image Credit: Chris Ciovacco
Does this mean we are going to shoot straight higher from here? Of course not, and we could well sell a decent pullback in the next few weeks as stocks have gotten a bit ahead of themselves in the short-term. However, if you can afford to take a 10 year view, it’s hard not to be excited about what might lie ahead, particularly with the rate of technological change currently underway. Who know what the world will look like in 10 years time, we might have colonized the moon by then.
Let’s talk about the flip side and look at the bearish case.
BEARISH CASE
There are probably not as many arguments that the bears can cling to right now, but there are a few that spring to mind as potential concerns.
- Margin Debt – This metric tends to peak a few months before the market does. When more investors are trading on margin, forced liquidations can occur pretty quickly when stocks start to slide.
Looking at the chart below of margin debt since 1995, we can see that margin debt peaked in March 2000, 5 months before the S&P 500 topped out. A similar peak in margin debt occured in July 2007, three months before the market peak.
The current level of debt is higher than those two previous peaks. It is also currently 4.6% below the record high reached in April last year. So while stocks have broken out the new highs, margin debt has fallen. Is this a concerning divergence? Time will tell. It will be interesting to see the November numbers when they are released.
2. Complacency – It’s fairly safe to say that just about every man and his dog is currently bullish. Could that be a contrarian indicator? Bears have been slaughtered that last two weeks and it’s not hard to imagine that the last ones have now thrown in the towel. Perhaps that means we are near a turning point?
The CNN Fear and Greed Index is currently at 87. The only higher readings in the last few years were in July 2014 and July 2016.
3. Short Term Too Extended – Potentially the market has come too far too fast since the election. While it’s hard to argue with the long term picture, in the short-term we may be due for a small pullback. A small pullback could be bullish longer term as it allows for the recent gains to be digested while the market resets for another bullish run. The RSI reading on SPY is at 77.04 one of the highest readings in the last 5 years.
The last chart I want to share could be both bullish and bearish. Either way, it is indicating big moves going forward.
The Bollinger Band width on the monthly chart is at very low levels that have not been seen very often in the last 34 years. Previously when the bands were this tight we saw some big moves.
In 1984-85 stocks went bananas for a couple of years before Black Monday.
In 1995 stocks went on a 5 year sustained bull run going from 500 to 1500.
In 2005 stocks pushed higher for another 2 years, not overly aggressively, before entering one of the worst bear markets in history.
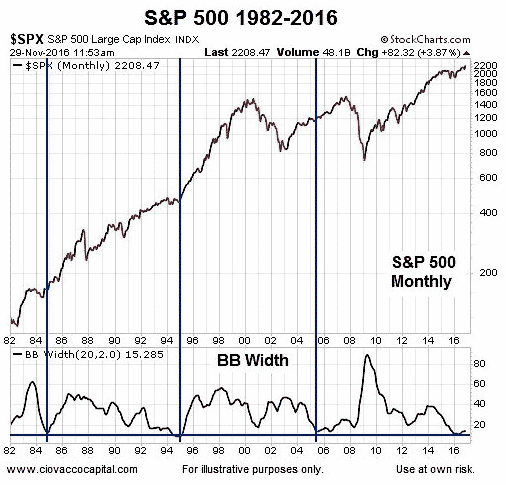
Image Credit: Chris Ciovacco
So there you have it, certainly something to think about for both the bulls and the bears. Either way, the next 5-10 years and even the next 5-10 weeks are going to be interesting!
Trade safe and please share this article on social media if you enjoyed it.
Disclaimer: The information above is for educational purposes only and should not be treated as investment advice. The strategy presented would not be suitable for investors who are not familiar with exchange traded options. Any readers interested in this strategy should do their own research and seek advice from a licensed financial adviser.


The Trump Bump will wane within the next two weeks. Earnings season is around the corner so we will have fresh earnings to base stock prices on. The market will be in a holding pattern until earnings for big player are known and measured against the market trend then. I believe another big stimulus will occur once Trump, as President, begins to execute the policies he’s promised; lower taxes, replace Obamacare, build the wall, and stop illegal immigration. A 20,000 DOW will be no problem.
Trump will not lower taxes; will not build the wall (thank the good lord) will not stop illegal immigration; and will not replace the “AFFORABE CARE ACT”. He is a racist and not qualified for the job of Presidency of the US. He is a pathological liar and all the “deplorables” that voted for him s=will soon be disappointed…and so will the stick markey
Hi Terry, it’s a valid point you make. Stocks have been rallying on an assumption of higher growth. Earnings have been dropping the last few quarters, so this earnings season will be very interesting and it may well put the brakes on this rally.
Trump will not do nay of this. he is a pathological Liar that WILL RUIN THIS GREAT COUNTRY….
I’m not sure where all this Trump bashing came from given that I didn’t really mention him in the article. Still, it’s great to have some lively discussion on the site, comments are always welcome.
Living outside the US, I am perplexed that Americans view Trump’s intentions as bullish for the US economy. To me they sound insular & bound to restrict trade &, thus, constrict growth. Giving tax breaks to under performing factories to preserve jobs doesn’t seem like an effective long term strategy to enhance American progress.
Are mere tax breaks really that significant to the US economy, or will they simply deplete the nation’s coffers for no advantage? A healthy workforce historically has led to greater productivity, so making healthcare less accessible seems counter-productive. A higher US dollar seems inevitable, & so do lower profits for multi-national US corporations whose products & services will become more expensive outside the US; is US domestic consumption really capable of off-setting the loss of foreign sales? What am I not seeing here?
Tend to agree with you Jack. I’ve been very surprised by the strength of this rally. Will be interesting to see what the next few months brings. Forgetting the fundamental side of things, the technical picture is very bullish. Perhaps the fundamentals will catch up with the technicals?