


Continuing in the fundamental analysis series, we are now going to take a look at the Interest Coverage Ratio, what it is, and how it might be helpful in evaluating an investment.
Contents
What is Interest Coverage Ratio?
Here, we can just break it down in terms of each individual word:
- Interest, which is the amount of finance charges being assessed on outstanding debts
- Coverage, which refers to the ability to cover – that is, pay for – the interest
- Ratio, which means there is some kind of comparison going on
In this case, we are comparing a company’s earnings to their ability to pay the interest on their debts.
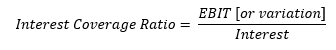
There are a number of ways to look at a company’s earnings, and each way will naturally affect the outcome of the ratio calculation.
The most common way is referred to as Earnings Before Interest and Taxes, or EBIT for short. Companies self-reporting their Interest Coverage Ratio, or investors looking for a more liberal view of Interest Coverage Ratio, may use EBITDA instead.
This would be Earnings Before Interest, Taxes, Depreciation and Amortization. However, another variation of earnings is EBIAT, or Earnings Before Interest After Taxes.
Taxes are often an important financial factor when evaluating a company’s financial picture, so looking at earnings after taxes may provide a “clearer”, albeit more strict, view of a company’s true earnings.
Because the number is literally how many times the earnings is more than the interest, this ratio is also sometimes referred to as the Times Interest Earned (TIE) Ratio.
Most often, the ratio is calculated over a rolling year, but can be calculated on any time frame so long as both the earnings and interest used in the calculation are for the same period of time.
What Does It Mean?
Quite simply, it tells you how likely a company is going to be able to service its debt, specifically in the near-term.
Ratios less than 1 mean that the company isn’t earning enough to even pay just the interest on its debt, which should be a huge red flag.
Typically, lenders (and investors) want to see a ratio greater than 1.5 before considering the company “safe” for lending to (or investing in).
However, as with the Debt to Equity Ratio, different industries may have differing standards, and what may be “safe” in one industry may not be “safe” in another.
Industries that are more susceptible to greater fluctuations, either with the economy or the workforce, may require a larger ratio before being seen as stable.
Speaking of Stability…
It is important to note that the ratio generally can and oftentimes will change over time.
It is merely a snapshot of a company’s financial picture at a given moment in time.
That is to say, just because you see a current Interest Coverage Ratio of, say 1.6, that doesn’t necessarily mean there’s reason to be concerned.
Likewise, a current ratio of 7 may look like a very comfortable number so there would be no reason to worry.
However, if last quarter the former company’s ratio was a 0.9 and the latter company’s ratio was 10, one could very well change their opinions of the two companies.
Therefore, rather than rely on a single calculation of the Interest Coverage Ratio for the most current period of time, investors may do well to look at the ratio over time.
For instance, looking at the ratio for each quarter over the past five years, an investor or analyst may see trends (either good or bad) that a single calculation wouldn’t provide.
Declining ratios may indicate that a company may have trouble paying its debts in the future.
While difficult to maintain a constant increase in that ratio, maintaining a high ratio over time is generally a good sign that the company has a good hold on their debts.
That may mean even if their debts are otherwise considered “high”, the company is in a good position to continue servicing those debts and is likely to do so in the future.
Be mindful, however, that there are no guarantees about the future.
Conclusion
The Interest Coverage Ratio is a metric one could use to help determine a company’s ability to service its debt in the near-term.
Generally speaking, higher is better, as it indicates the company’s earnings are more sufficient to handle the company’s financial obligations.
When comparing companies, however, one should stay within the same industry, and ideally only compare companies with similar business models and revenues, as these may impact the ratio, making it more difficult to decide which is “better”.
Also keep in mind that this ratio can fluctuate over time, so the most recent ratio may not be enough to determine trends or the potential trajectory of a company.
Trade safe!
Disclaimer: The information above is for educational purposes only and should not be treated as investment advice. The strategy presented would not be suitable for investors who are not familiar with exchange traded options. Any readers interested in this strategy should do their own research and seek advice from a licensed financial adviser.


