


Forecaster.biz is an online financial software for assisting traders and investors in analyzing various financial assets in the market, including stocks, ETFs, indices, Forex, commodities, and even crypto-currencies.
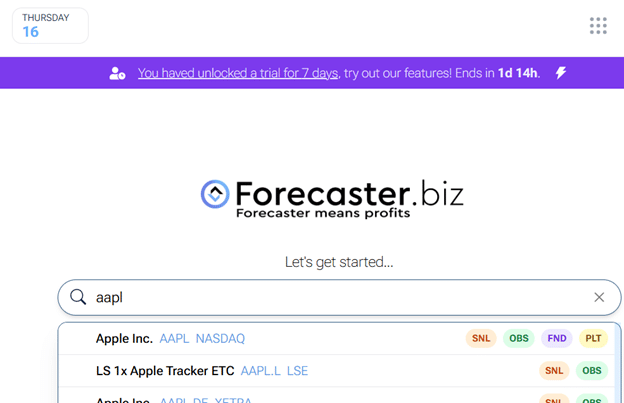
Its designers attempted to make the user interface clean, simple, and intuitive, reminiscent of the spare look of the original Google search engine.
Contents
Just start typing the ticker symbol or the name of the company you have in mind to get started:
Here, we see that it graphs Apple’s net income over the last five years in comparison to its stock price:
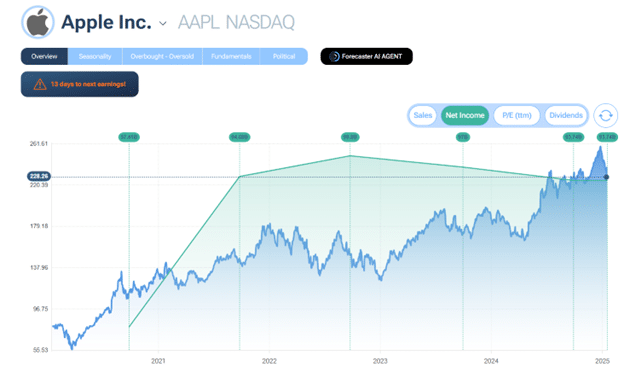
You can do the same for sales, trailing twelve months’ P/E ratio and dividends.
I didn’t even know Apple’s next earnings report was in 13 days.
Good thing I came to this page and saw that alert icon.
You can run the chart over other time frames:
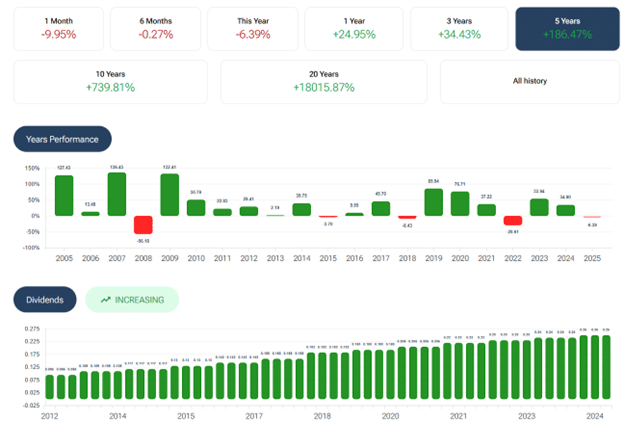
We see in that bar chart that Apple’s stock price went up (green bar) for most years and made a 739.8% price increase in the last 10 years.
It has increasing dividends, too.
Value Investor
For the value investor, Forecaster has three fair value models built in:
- Discounted Cash Flow model
- Peter Lynch Fair Value model
- Economic value Added model
It averages the results of these three models and gives an “average fair value” price.
It then charts this fair value in relation to the actual stock price.
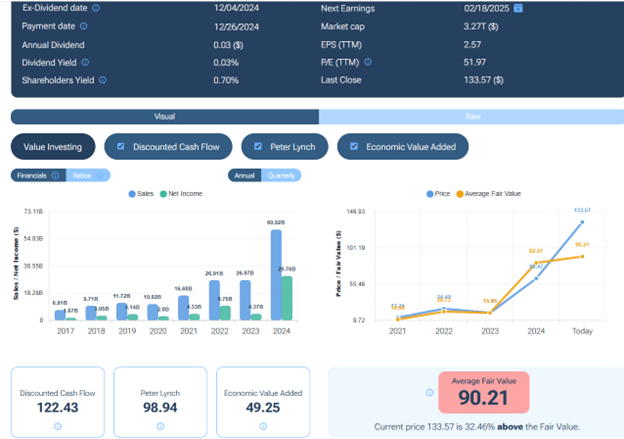
We see that Nvidia’s current stock price is 32% above the average fair value price of $90.21.
Perhaps if the investor sees that the sales histogram and the net income are consistently increasing year over year (for the most part), they may still decide to buy.
Or maybe not.
Forecaster is not going to make that decision for you.
But at least it gives you visual information to make this decision yourself.
Still can not decide?
Let’s see what the Forecaster AI Agent says…
Forecaster AI Agent
But not for NVIDIA; I want to use a variety of stock examples.
So let’s use the fairly new AI Agent (available only as of December 2024) on the stock Microsoft…
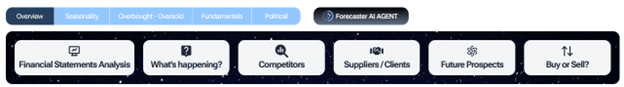
It presents me with a series of buttons.
I click the “Buy or Sell” button to get right to the point.
Should I buy or should I sell Microsoft?
Well, that depends a bit on the time horizon.
According to Forecaster’s AI agent, Microsoft is a “buy” for short-term investors with a one-month time horizon.
It gave a score of 6 out of 10 for a buy.
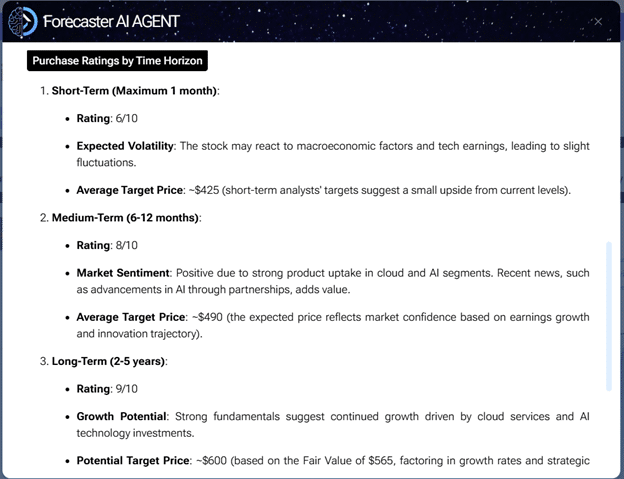
For medium-term investors (6 to 12 months), it is an even stronger buy with a rating of 8 out of 10.
And for long-term investors with a holding time of 2 to 5 years, it is a very strong buy with a 9 out of 10 rating.
The agent will also tell you its estimated average target price for each time horizon.
Value Generation Measure
Based on various “value generation” metrics shown below…
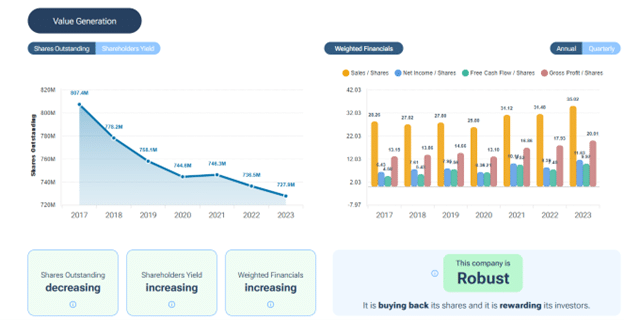
Forecaster gives McDonalds a rating of “Robust”.
The highest of its four possible ratings:
Robust
Resilient
Steady
Weak
It is a valuation of the capacity of the company to return value generation to shareholders.
According to the info icon, this value generation model cannot be applied to financial companies such as banks, insurance companies, etc.
For The Financial Analysts
For those who know what EBITDA means, or those who like to see the raw numbers (maybe copy and paste them into their spreadsheet to do their number crunching), they can flip through the annual and quarterly tables for income statement, balance sheet, and cash flow.
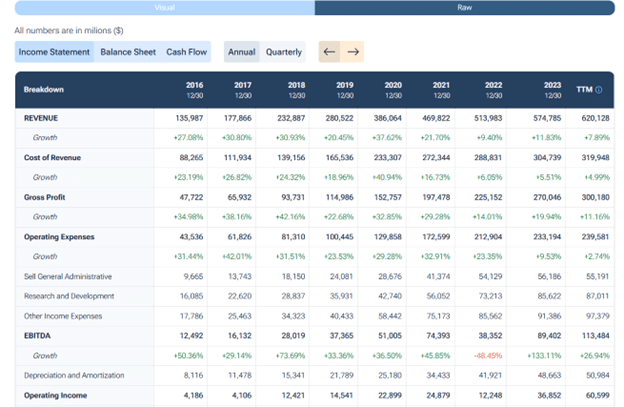
These happen to be Amazon’s financial numbers.
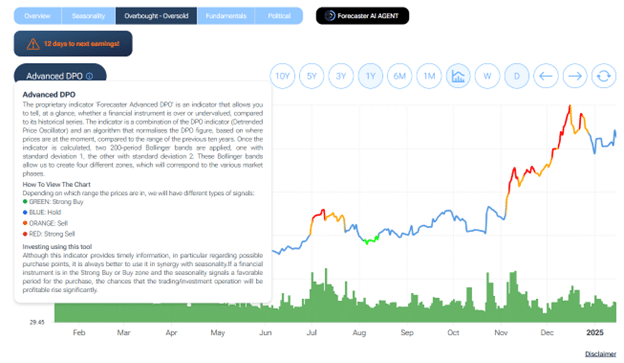
Overbought Or Oversold
In the Overbought / Oversold section of Forecaster, there is an interesting graph with funny colors and also a histogram underneath:
Hmm, I’ve never seen this before.
Upon clicking on the info icon, I see that this “Advanced DPO” is a proprietary indicator by Forecaster.
This means that no one else has this.
This is a line graph of Tesla’s stock price.
And the histogram is the volume.
The color of the line graph is the indicator of whether the stock is overbought or oversold.
How that is calculated is the proprietary part.
Piotroski F-Score
Alphabet Inc’s Piotroski F-Score is a 7 out of a possible 9.
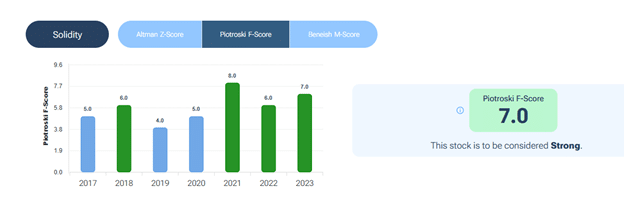
This means that it is financially strong based on accounting professor Joseph Piotroski’s nine criteria that assess profitability, leverage, liquidity, and source of funds.
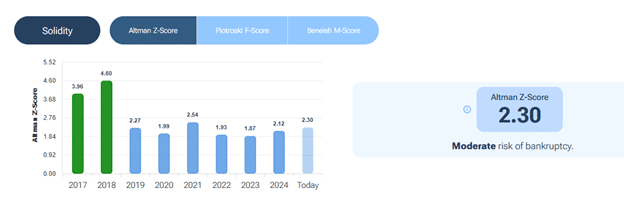
Altman Z-Score
According to Disney’s Altman Z-Score, it is at a moderate risk of bankruptcy.
Let’s hope not.
Young children still want to watch Disney movies and go to Disneyland.
The higher the Altman Z-Score, the lower the risk for bankruptcy.
This is based on how far the company’s financial ratios are from those of distressed firms.
Beneish M-Score
Meta’s Beneish M-Score indicates that it is unlikely to be manipulating its earnings.
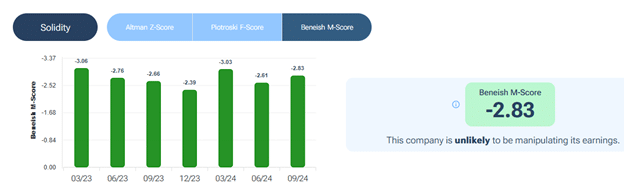
It is a mathematical model developed by Professor Messod D. Beneish that uses a company’s financial ratios to identify whether a company’s earnings may have been artificially inflated.
The disclaimer is that it can not be determined with 100% accuracy and cannot be applied to financial companies such as banks, insurance companies, etc.
Revenue By Products
The Revenue-by-products graphs show that Coca-Cola makes most of its revenue from selling Coca-Cola. No surprise.
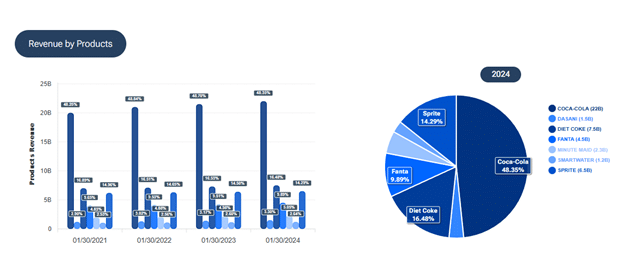
It makes more from selling Coke than from Diet Coke.
We can see that it also sells SmartWater.
Insider Transactions
Some investors may like to look at company insider transactions, including stock sales or purchases.
Most of the time, you will see high-level important insiders selling shares of stock in their company.
This is not unusual and doesn’t mean a whole lot.
People sell shares for many different personal reasons.
They may need money to purchase a house, a boat, or whatever.
They may be going through a divorce or other financial or legal issues.
Who knows?
Or they may simply be overweight in exposure to this one stock and need to diversify their portfolio allocation.
However, when one of the logs shows an insider purchase, as in the case of a director of Caterpillar Inc. who purchased common stock just a month ago, that may catch one’s attention.
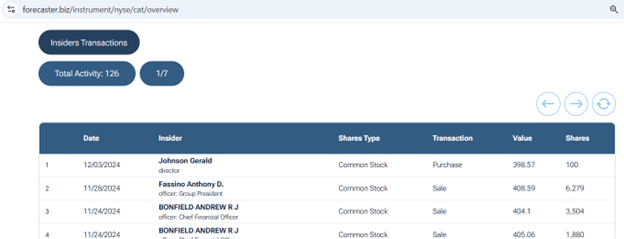
However, in this case, it was a purchase of only 100 shares (not a lot for a director).
Political Buying
Instead of company insiders, maybe you want to know whether politicians are buying a particular stock.
Here, we see a few politicians on both sides of the aisle are buying JP Morgan Chase…
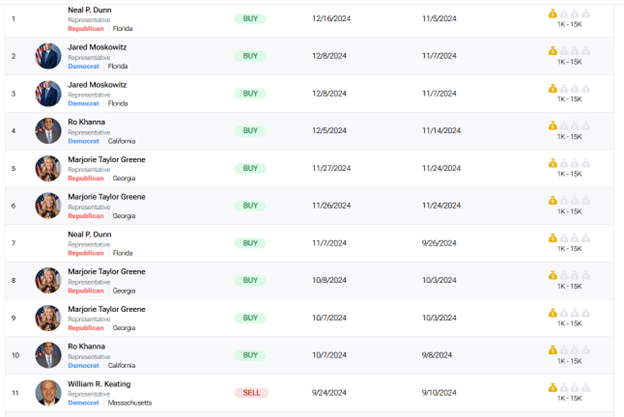
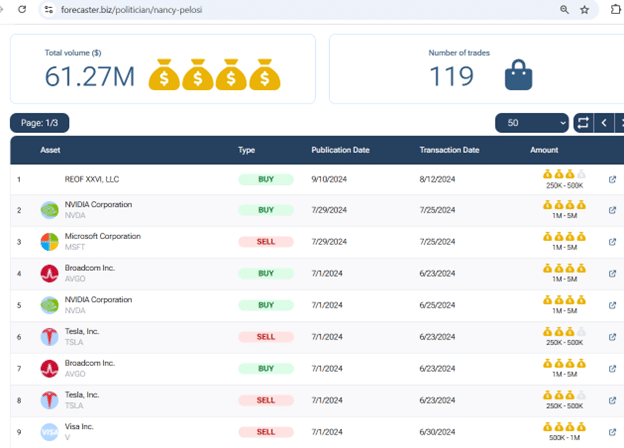
You can even search for a particular politician that you want to “follow.”
I’m using Congressperson Nancy Pelosi in the example below because she invests a good volume of money – $61 million worth of investment.
COT Report
If you search for the S&P 500 index by typing in the ticker symbol GSPC:
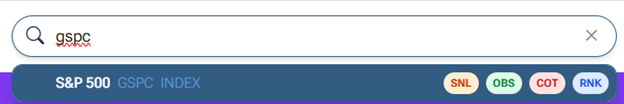
You will see that it has an extra tab in the menu for the “COT Report.”
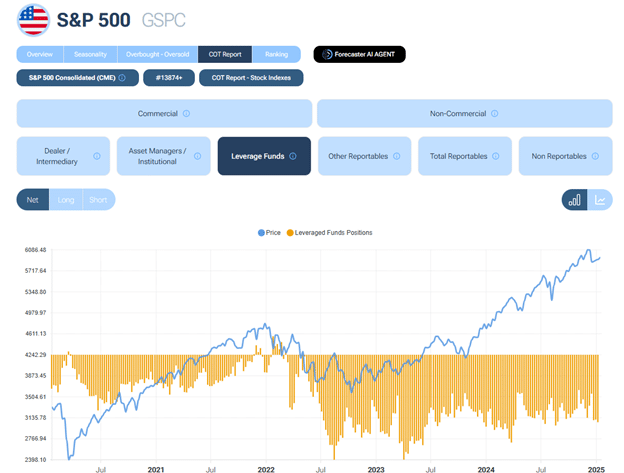
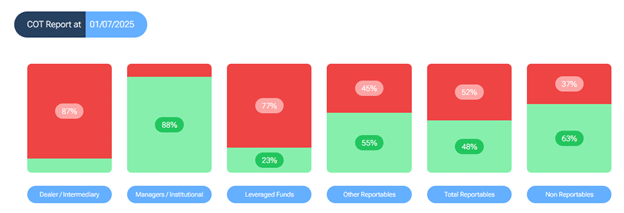
This information can be gathered from the Commitments of Traders reports but in a much more readable format.
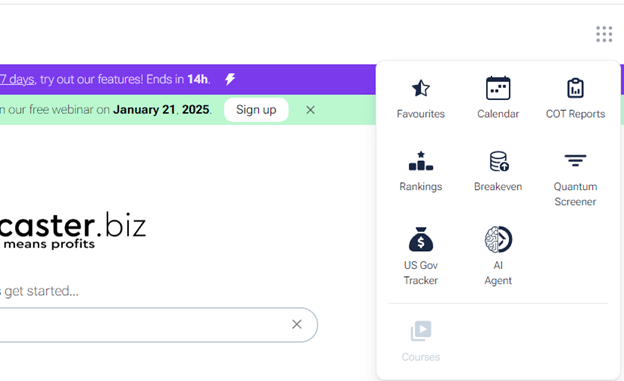
Wait, There Is More
In the upper right corner of the Forecaster Terminal (which this online website calls itself), you will find another menu icon that, when clicked, will give you access to a few other features.
Clicking the Rankings icon, we have all the major indices: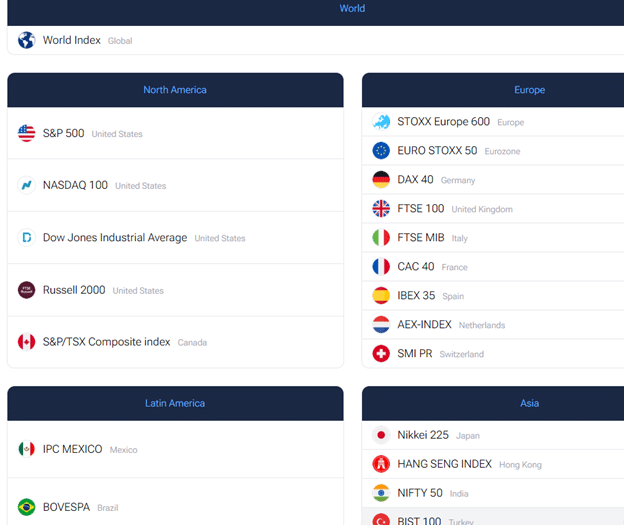
Clicking on the S&P 500, we can see whether the S&P 500 is overvalued or undervalued…
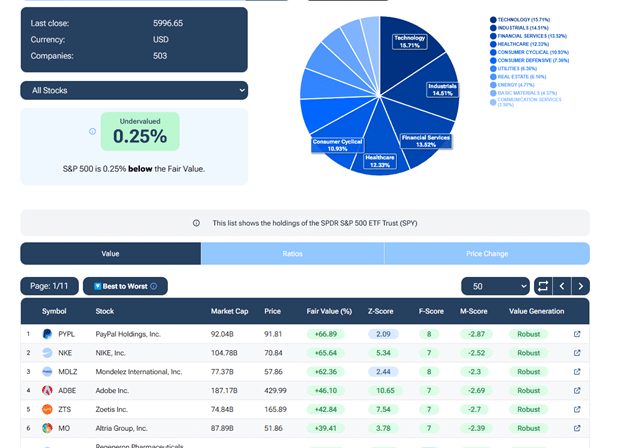
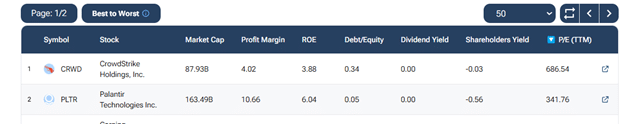
We can further sort its constituents from best to worst, or vice versa, based on Fair Value, Z-Score, F-Score, M-Score, or its value generation.
If you are looking for a trade idea in technology, you can filter the S&P 500 constituents to show only stocks in the Technology sector…
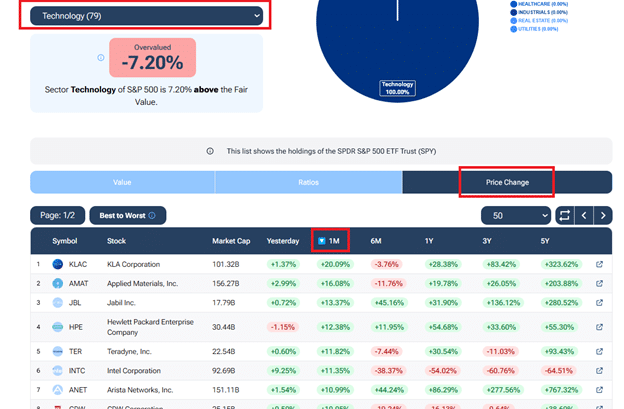
Then, it will be sorted by the best price-performance in the last month.
Or you can sort by P/E ratio, dividend yield, and other ratios shown:
Summary
Forecaster visually represents fundamental data on stocks, ETFs, indices, commodities, Forex, and cryptocurrencies.
To some investors, having all this information gathered and summarized visually saves a lot of time and is well worth the subscription cost for this tool.
For others, they feel that they can get a lot of the same information on other free websites.
Whether it is worth it for you or not, you can determine for yourself by trying it out using the 7-day free trial.
We hope you enjoyed this review article on Forecaster.
If you have any questions, please send an email or leave a comment below.
Trade safe!
Disclaimer: The information above is for educational purposes only and should not be treated as investment advice. The strategy presented would not be suitable for investors who are not familiar with exchange traded options. Any readers interested in this strategy should do their own research and seek advice from a licensed financial adviser.


