


Contents
- What is Dollar Cost Averaging?
- Why Dollar Cost Average?
- Asset Selection
- The Math
- Creating A Dollar Cost Average Calculator
- Fractional Shares
- Closing Thoughts on DCA
What is Dollar Cost Averaging?
Dollar cost averaging is an investment strategy in which an investor divides up the total amount they want to invest in a particular stock and buys that stock at regular intervals over a certain period of time.
This is done to reduce the impact of volatility on the overall investment.
Timing the market is a nearly impossible task, so this is the strategy you would use to invest, and it, more times than not, beats someone who invests a lump sum all at once.
An example of how to dollar cost average into a position is as follows: You would first decide on the total amount you want to invest and the frequency that fits your needs.
For this example, let’s say you want to invest $1,000 per year into an asset and make a purchase once a month on the first trading day.
You would take the $1,000 and divide that by 12 months, and you would get $83.34/month invested.
Now on the first day of every month, you would purchase $83.34 worth of the asset.
That’s it.
Congratulations, you just dollar cost averaged a position.
Why Dollar Cost Average?
Well, now that we have the very basics of DCA explained, you might be asking, “Why would I do that, to begin with?” and that’s an excellent question.
The principle of dollar cost averaging works over the entire life of your position.
This is not a strategy most people actively trade with because it relies on price fluctuations over the span of days, weeks, or months.
It is one of the most powerful investing techniques because you automatically purchase more shares when the price is low and fewer shares when the price is high.
This is done by default because you are purchasing based on a fixed dollar amount, and this is why time is such an important component of this investing technique.
Price does not always go up in a straight line, so breaking the investment up into smaller chunks allows you to get in across the spectrum of prices.
While this may not sound like a great idea, over time, this beats lump sum investing, which is why many asset managers adopt the saying, “Time in Markets always beats Timing Markets.”

The most common application of dollar cost averaging is something you are probably already familiar with, and that is your retirement account.
Over the course of your career, you place small investments into an account that is set aside for when you are no longer working.
Each paycheck (usually), you purchase a few shares of a stock or fund, and over time you accumulate a larger and larger position.
Now let’s assume that when you start working, the fund’s price is $50.00/share and that you could invest all of the money you would accumulate over your career, would you?
Think about the odds that you are getting in at the absolute lowest price; they are almost zero.
That is why DCA is such a powerful strategy.
It makes the odds of market timing irrelevant.
When you start to look at investing through this lens, it will start to alleviate some of the worries that often come with putting money in the market.
Over the course of history, the market has always gone up, and there have been periods of deep drawdowns, but if you were dollar cost averaging into your investments in those periods, it would have been a fantastic buying opportunity.
During the peak of all the panic, you could have been secure in knowing that you had been buying an asset for months or for years and that even with a steep 20% or 30% correct, this is just a buying opportunity to better your average cost.
It is only helping you acquire more shares at a better cost.
This will not remove the pain of seeing red on your portfolio statement, but it should make you feel more secure in the knowledge that you have been in this position for a long time, which is just one of many buying opportunities.
Asset Selection
It is very important to know what asset you select is probably the most important part of the dollar cost averaging process.
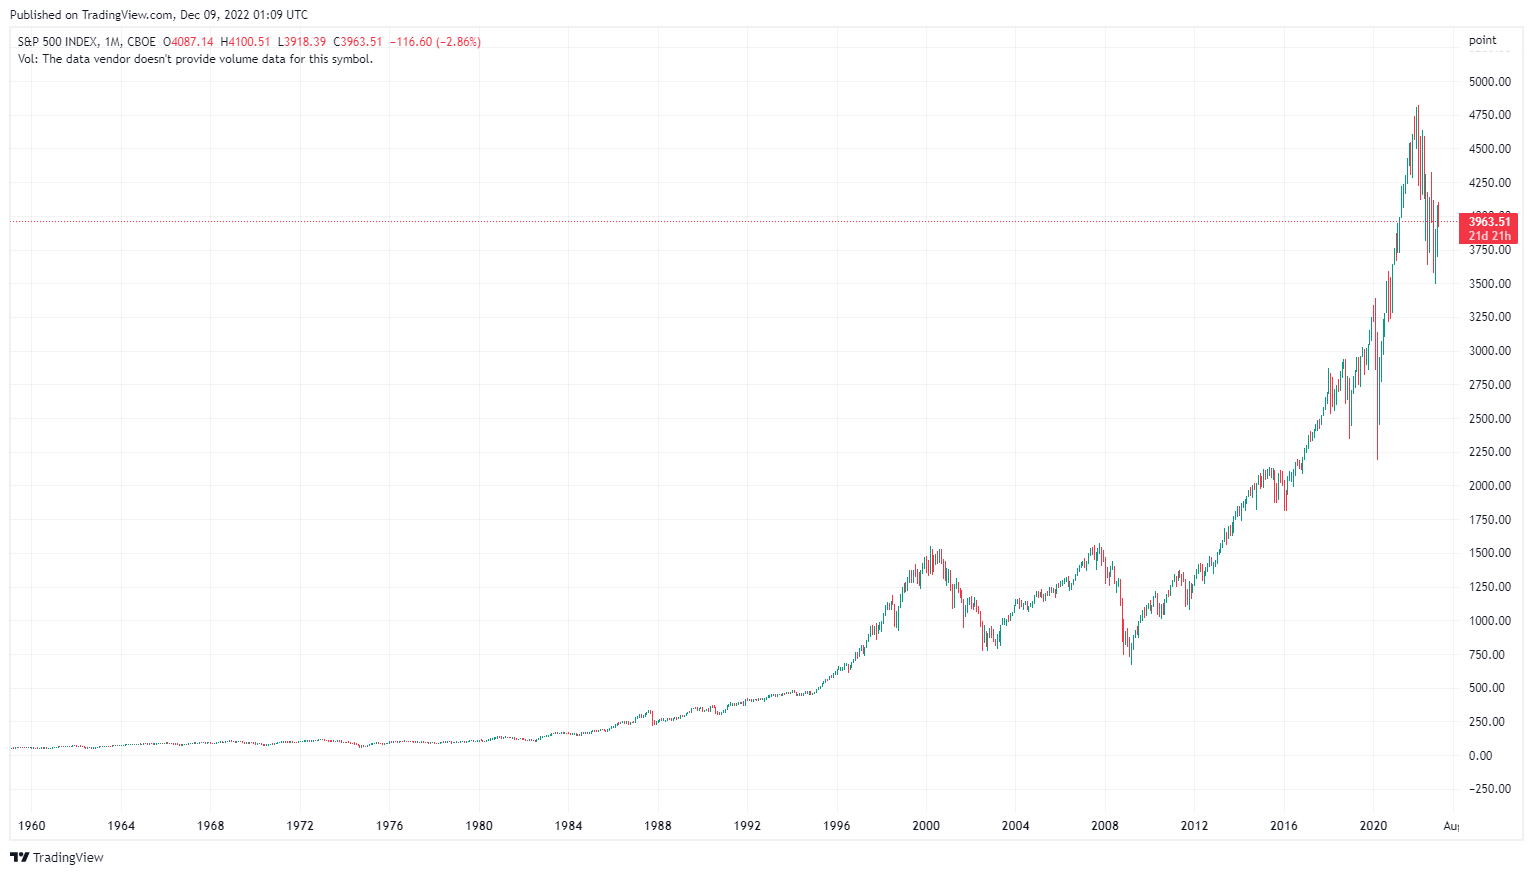
Above I said that over history, the market has always gone up, and the chart below illustrates that point over the last 70 years.
This is why asset selection is important.
If you had been investing in a broad market fund that paid dividends, you would have profited handsomely.
If you were in Enron, you would not have.
So always try to stick with well-diversified funds and mimic the general market.
Dividends are also a huge plus because they compound your capital faster.
The Math
So now that we know what dollar cost averaging is, why we do it, and how to pick a good asset for it, let’s talk about how to calculate your average cost.
This is more important if this is not in a tax-deferred account.
It is silvery important to always have an idea of where the cost of your position is.
The math for this formula is pretty simple, though.
It’s the same way you would find any other average: you take your total amount invested and divide it by your total number of shares.
Below is an example of how this would look after a year of investing.
January – $100 @ $10/share = 10 shares purchased
February – $100 @ $9/share = 11.11 shares
March – $100 @ $11/share = 9.09 shares
April – $100 @ $13/share = 7.69 shares
May – $100 @ $14/share = 7.14 shares
June – $100 @ $15/share = 6.67 shares
July – $100 @ $13/share = 7.69 shares
August – $100 @ $12.50/share = 8 shares
September – $100 @ $13/share = 7.69 shares
October – $100 @ $11/share = 9.09 shares
November – $100 @ $8.75/share = 11.42 shares
December – $100 @ $11/share = 9.09 shares
After a year of investing at the above rate and prices, you would have accumulated 104.68 shares of stock.
You would calculate your average cost by taking the $1,200 invested over the year and dividing it by 104.68, and it would make your average cost $11.46/share.
This is also assuming no dividends were reinvested, which is why asset selection is so important.
Creating A Dollar Cost Average Calculator
There are many calculators online that let you put in costs after you have already accumulated the position, but what if you want to know the average running cost as you are building the position?
This is where a home-built spreadsheet comes in handy.
Personally, I use excel, but there are plenty of free options like Google sheets available to do this with.
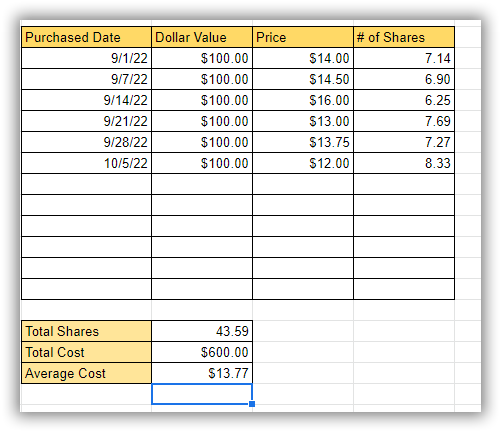
First, you will want to have a purchase date column followed by the dollar value column, which should stay more or less the same for every purchase.
Next up is a column for the Share price you purchased at, and finally, in the last column, the number of shares you purchased.
Underneath this table, I also like to include a place for Total Shares, Total Cost, and Average Cost, as shown in the image below.
So now that you have the basic format setup, we can add a little automation to help get the calculations set.
You can set the number of shares column as a calculation, but this should be manually entered from the actual transaction statement.
In the Total Shares box, you will auto-sum the entire “Number of Shares” column, and then you will do the same with the “Dollar Value” column for the total cost.
Finally, you will Divide the “Total Cost” box from the “Total Shares” box, and you will get your average cost.
Now the beauty of this calculator is that it will automatically update as you continue to enter transactions making it so you can see your average cost in real-time.
You can download the dollar cost average calculator here.
Fractional Shares
Now you may have noticed that all of the share values are not whole numbers.
There are a few ways around this.
First and now, the most common is brokers allowing you to purchase fractional shares.
This is a feature that may need to be enabled, but it is something some brokers currently allow.
Since it has become so common, if this is an investing strategy that interests you, then it is recommended you trade with a broker that allows it, but it is more than likely that your current broker already does.
A second and less desirable approach is to purchase the closest number of whole shares.
This will often leave you with a little bit of capital left over, which will be deployed with your next deposit.
Closing Thoughts on DCA
So is dollar cost averaging worth it?
Absolutely.
Over time you will accumulate a position in a security in manageable chunks.
On top of this strategy, using the power of market volatility in your favor also makes investing much more manageable for the average person.
You never need to come up with a huge chunk of capital or worry about timing the market bottoms and tops, you can simply set it and forget it, and it will continue to make your money work for you.
Above, you learned not only the benefits of dollar cost averaging but also how to set up a basic dollar cost average calculator so that you can track your investment costs in real time!
We hope you enjoyed this article on dollar cost averaging.
If you have any questions, please send an email or leave a comment below.
Trade safe!
Disclaimer: The information above is for educational purposes only and should not be treated as investment advice. The strategy presented would not be suitable for investors who are not familiar with exchange traded options. Any readers interested in this strategy should do their own research and seek advice from a licensed financial adviser.


