


In part 1, we learned divergences and hidden divergences in an uptrend.
This article will show examples of divergences and hidden divergences in a downtrend.
Contents
Bullish Divergence in a Downtrend
When looking for divergences in a downtrend, we examine the valleys because they represent pushes made by the bears.
Consider the following downtrend in this daily chart:
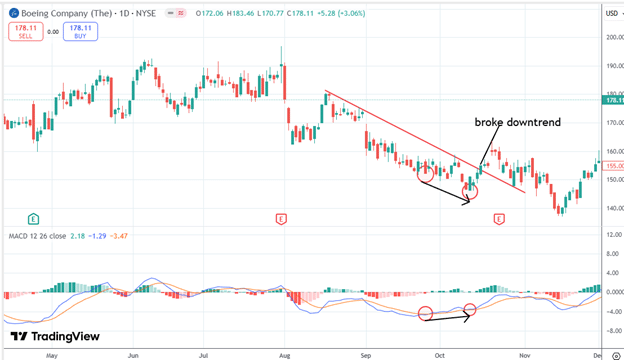
For the most part, the blue MACD line in the bottom panel follows the shape of the price, except in late September 2024, when the price went down and the MACD was going up.
The downward momentum of the bears has decreased.
This is a bullish divergence, suggesting an upward price movement to follow.
Shortly after, we saw that the long-standing downward trendline broke as the price moved upward in a strong rally in mid-October.
Bearish Hidden Divergence in an Uptrend
When looking for hidden divergences in a downtrend, we look at the peaks because the counter-trend makes the peaks pushed by the bulls.
Consider the bear trend in Colgate-Palmolive (CL) in late 2024.
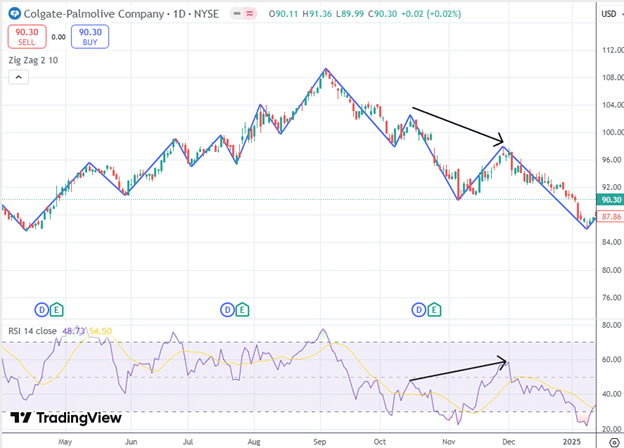
Here, we see that the counter-trend push by the bulls in November 2024 could not push prices up despite RSI showing a higher peak.
This is a bearish hidden divergence suggesting lower prices to follow.
A higher peak in RSI can be interpreted as a more overbought condition than the previous lower RSI peak.
Hence, it might be a good value for bears to start shorting.
In this case, the bears successfully continued the downward trend and pushed RSI back down.
Reverse Divergences
Sometimes, you may hear the term “reverse divergences.”
That is synonymous with “hidden divergences”.
We would rather use the term “hidden divergences.”
Using “reverse divergences” will add to the confusion because it sounds too close to the word “reversal,” and we know that hidden divergences are not reversal signals.
Furthermore, we see that Investopedia is using the term “hidden divergence”…
“Hidden divergence is a lesser-known but powerful concept in technical analysis that involves a discrepancy between the direction of price movement and the direction of a technical indicator.
Hidden divergence signals are particularly valuable for traders as they provide early indications of trend continuation.”
Summary
In an uptrend, we look for divergences in price and momentum by looking at the peaks.
We look for hidden divergences by looking at the valleys.
In a downtrend, we look for divergences by looking at the valleys and hidden divergences by looking at the peaks.
Whenever we find a divergence or hidden divergence, there is a discrepancy between what the price is saying and what momentum is saying.
When we find a divergence, we go with what momentum tells us.
We go with what the price tells us when we find a hidden divergence.
While a divergence signal is a counter-trend signal, a hidden divergence always signals us to go in the direction of the trend.
As such, we only find bearish divergences in an uptrend.
We only find bull-hidden divergences in an uptrend.
Similarly, we only find bullish divergences in a downtrend.
We only find bearish hidden divergences in a downtrend.
For an uptrend, traders will monitor for divergences to tell them that the uptrend may be losing momentum or slowing down.
Traders will monitor for hidden divergences for buying opportunities in a continuing uptrend.
For a downtrend, traders will monitor for divergence to tell them when the downtrend may be ending.
Traders will monitor for hidden divergences for more downside activities.
The two most popular indicators for monitoring these are the RSI and the MACD.
Are you totally confused by now?
First, it is best to understand all the concepts of divergences and hidden divergences in an uptrend.
Once you have mastered and looked at enough charts with uptrends, attempt to do similarly for downtrends.
Admittedly, trying to learn this while mixing uptrends and downtrends can be quite confusing.
We hope you enjoyed this article on divergence and hidden divergence.
If you have any questions, send an email or leave a comment below.
Trade safe!
Disclaimer: The information above is for educational purposes only and should not be treated as investment advice. The strategy presented would not be suitable for investors who are not familiar with exchange traded options. Any readers interested in this strategy should do their own research and seek advice from a licensed financial adviser.


