


Today I want to run through an example of a diagonal put spread, one of my favorite strategies.
I’ll use a random number generator to pick a trade date and a stock and then walk through how the trade would have gone.
By using a random number generator it makes it completely random and means I haven’t cherry picked the best entry point.
I’ll be using Option Net Explorer for the back test. These will be the parameters:
– Sell a 1 month put around 15 delta
– Buy the next month put at around the same price
– Stop loss 20% otherwise hold to expiration
– Profit target 10%
– Only using end of day pricing
The first example provided by the random number generator is LMT with a trade date of November 6th, 2018.
Here’s how the trade would have looked at initial set up.
Date: November 6, 2018
Current Price: $307.45
Trade Set Up:
Sell 1 LMT Dec 21st, 280 put @ $2.95
Buy 1 LMT Jan 18th, 270 put @ $2.98
Premium: $3
Max Loss: $1,003

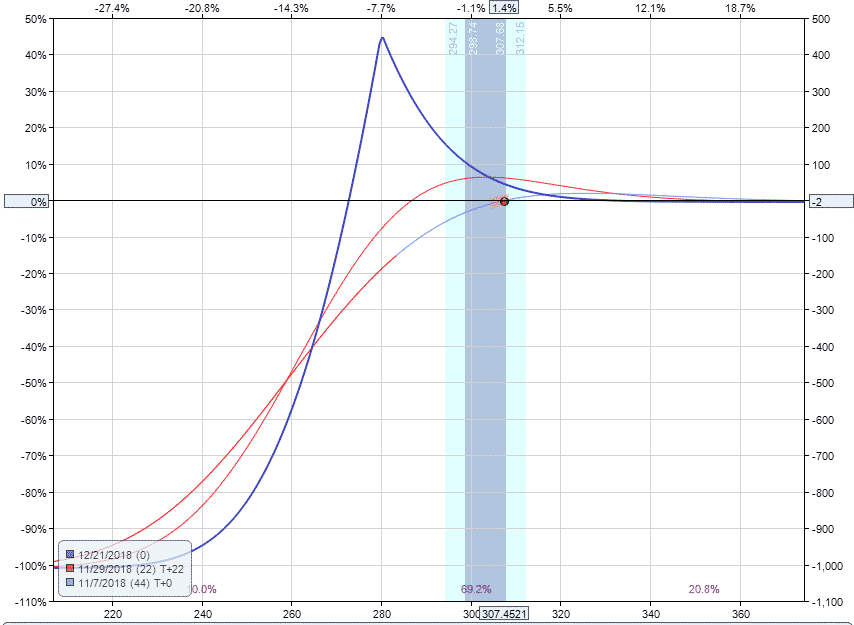
The trade was never under much pressure despite the stock dropping down to 270 at one point and the profit target was achieved on December 12th with the stock trading at 294.
The video below shows the progression of the trade.
Let’s now take a look at an example of a losing trade to see how that looks.
For this one, rather than choose a random date I wanted to specifically find a point where the trade would have the worst case scenario – a big drop in the stock price within the first few days.
In May 2020, SHOP was trading at 825 and then dropped to 750 within a few days.
Date: May 22, 2020
Current Price: $825.17
Trade Set Up:
Sell 1 SHOP June 19th, 700 put @ $12.65
Buy 1 SHOP July 2nd, 660 put @ $12.15
Premium: $50 net credit
Max Loss: $3,950
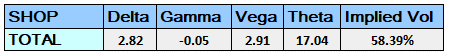
After one trading day, SHOP fell to 767.89, a drop of 6.94%. The trade was -$117 or -3%, so holding up ok considering the massive drop.
The next day, the stock was down another 2.33% and the trade was -267 or -6.76%.
That’s actually as low as the trade got, from there it came back into profit pretty quickly as the stock started to bounce.
I thought for sure this would be a losing trade. Let me find another one.
On March 4th, 2020 AAPL was trading at 298.33 (before the stock split).
Date: March 4, 2020
Current Price: $298.33
Trade Set Up:
Sell 1 AAPL April 17th, 255 put @ $3.95
Buy 1 AAPL May 15th, 240 put @ $4.15
Premium: $20 net debit
Max Loss: $1,520
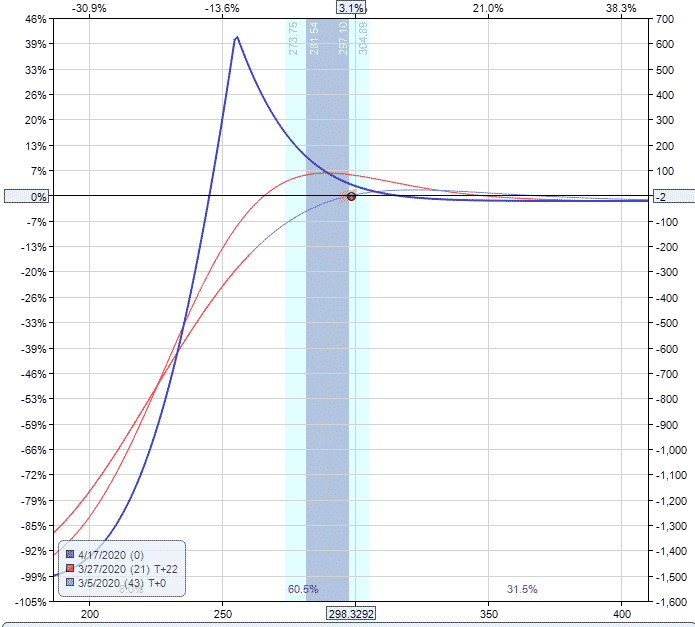
You can see below that the trade was under pressure from day one and eventually blew right through the stop loss of 20% and ended with a 41.25% loss.
But, there were plenty of chances to exit for a much smaller loss before this.
One extra rule I will add for diagonal put spreads is to close the trade if the short strike get breached.
That occurred in this example on March 12th, which would have resulted in the trade being closed for a 10.33% loss or -$157.
Watch the trade progress in the video below:
I really love using Option Net Explorer for back testing things like this. If there any other back tests you want to see, just let me know.
I hope you enjoyed this quick tutorial on diagonal put spreads.
Trade safe!
Disclaimer: The information above is for educational purposes only and should not be treated as investment advice. The strategy presented would not be suitable for investors who are not familiar with exchange traded options. Any readers interested in this strategy should do their own research and seek advice from a licensed financial adviser.


Sl is 20% of what exactly?
The profit taking is 10% of max profit?
Capital at risk was $1,000 so the stop loss was $200 and profit target was $100
thx for answering
This trade would require $7300 worth of margin. What kind of profit target are you shooting for? 10% of 7300? The trade is put on for basically even money. 10% of the $300 credit is $30 but that seems like a really low return on capital.
Hi John,
The max loss on the trade is $1000 so that is the margin requirement. Profit target of 10% s $100 per contract.
A little reality check from the parameters
– Sell a 1 month put around 15 delta
the 21 dec is more like 1 1/2 month away or 45 days
– Buy the next month put at around the same price
How is 207 anywhere near 280 ? I guess that was a typo because I see it in the table as 270
Interesting how the profit was achieved just before the stock started to drop like stone Was that just a coincidence ?
I am not sure if this proves that you can do a diagonal trade at any random point and make a profit in any underlying
Hi Mike, the monthly options were either 15 days or 45 days so I chose 45 days. 207 was a typo, fixed and is now 270.
I’ll add some more examples to this and find some losing trades as well. Obviously there is no strategy that will win 100% of the time.
Hi Gavin, How did you came up with the 10 en 20% pt and sl? Did you backtest these figures ? Thanks in advance