


The bull flag pattern is a chart pattern that starts out with a bullish impulsive move-up followed by a tight consolidation before continuing with its bullish run.
Contents
What Is A Bull Flag Pattern?
Bull flag patterns on stocks in a strong uptrend are considered strong continuation patterns.
They are called They are called bull flags because the pattern resembles a flag on a pole.
The pole is the result of a vertical rise in a stock and the flag results from a period of consolidation.
The flag pattern can be either a horizontal rectangle shaped, or it can be slanted downwards as shown in the following Walmart Example.
A bull flag pattern is very similar to a bullish pennant.
Bull Flag Example
Here is a classic example of a bull flag seen in Walmart (WMT).
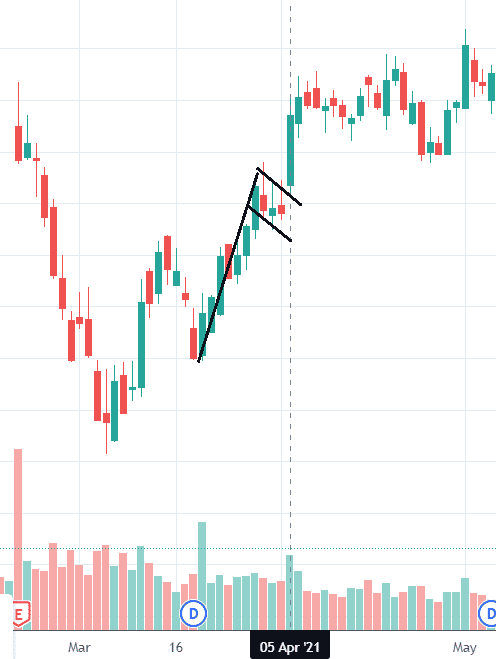
The flagpole is the strong impulsive move up.
Small retail traders are not able to cause the chart to paint candles that look like that.
The flagpole is often generated by large institutions buying the stock.
This is followed by 3 to 5 candles of consolidation, which form the flag.
Note that the size of the candles in the flag is much smaller than the candles that make up the pole.
The smaller the bodies, the tighter the flag is, the better.
The flag is often tilted down similarly to a pullback.
This gives time for the market to digest the strong move up.
Some amount of profit-taking after a large move is healthy.
The expectation is that after some buyers have sold their position in this flag region, the stock price will continue its upward move.
And exactly that is what happened in Walmart and is expected to happen when a bull flag pattern forms.
Bull Flag Failure Pattern
Chart patterns do not always work.
Failed chart patterns can be just as important.
Knowing when the pattern fails and getting out of the trade (or perhaps reversing the direction of the trade) is good to know.
Here is a bull flag pattern on the SPX that fails.
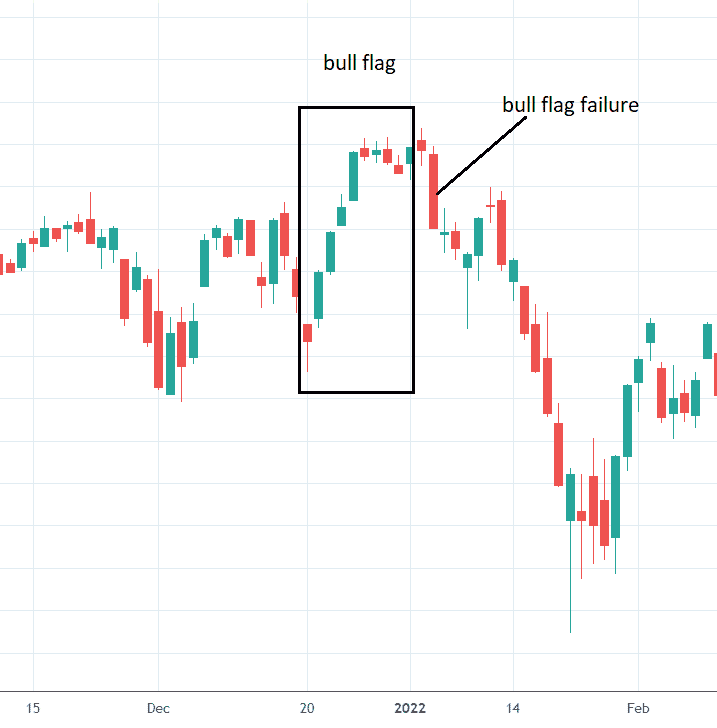
A trader trading the bull flag would often put a stop just below the flag.
That big red candle on January 5, 2022, which dropped below the flag, is a tell-tale sign that the pattern failed.
If what should happen doesn’t happen, then consider the opposite move.
The bull flag pattern is bullish.
The failed bull flag pattern is bearish.
And in this case, the price went all the way down past the start of the flagpole.
FAQs
How do you trade the bull flag pattern?
Some traders like to go long as soon as they see the flag formation.
That way, they get into the trade early and be there to capture the price breakout from the consolidation.
Other traders prefer to wait for confirmation.
In other words, they will go long only after seeing the price close above the flag.
This has a higher chance that the movement will play out as expected.
But it has a lower profit potential because it misses the early part of the move.
By waiting for confirmation, the trader can let the market indicate which direction it wants to go — whether it is going to be a bull flag pattern or whether it is going to be a failed bull flag pattern.
How long is the flag consolidation?
The typical flag lasts 3 to 5 candles.
If it lasts longer than that, be suspicious of possible flag pattern failure.
Does the bull flag pattern work on all time frames?
Yes, this pattern applies to intraday charts, daily charts, weekly and monthly charts, and all time-frames.
How far can we expect the price to go up after the flag pattern?
The market often will make “measured moves” that are symmetrical.
Hence, the price can go up the same distance as the length of the flag pole.
For instance, in the Walmart example, the price went above the flag by almost the same amount as the pole’s length.
However, asking for a stock price to go up this much may be asking a lot.
A more conservative trader may start to take partial profits at 50% of the measured move up.
Selling the stock while it is still going up is called “selling on strength.”
Conclusion
The bull flag pattern is a continuation pattern.
The better-performing flags are ones where there is a strong flagpole, and the flag is in a tight formation.
That means the consolidation region should have smaller candles that overlap each other.
The candles in the flag should not be loose, with lots of gaps and parts of the candles going all over the place.
Trade safe!
Disclaimer: The information above is for educational purposes only and should not be treated as investment advice. The strategy presented would not be suitable for investors who are not familiar with exchange traded options. Any readers interested in this strategy should do their own research and seek advice from a licensed financial adviser.


