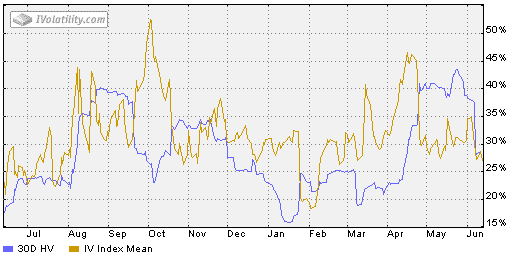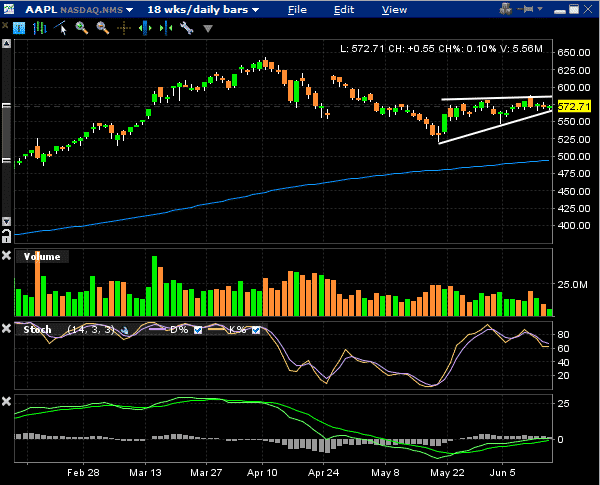
AAPL seems to be consolidating in a very tight range and is due for a breakout. Implied volatility is also quite low around 27%, so let’s look at a couple of trade ideas on how to play an AAPL breakout and subsequent rise in implied volatility. These are not trade recommendations and are just provided for educational purposes only.
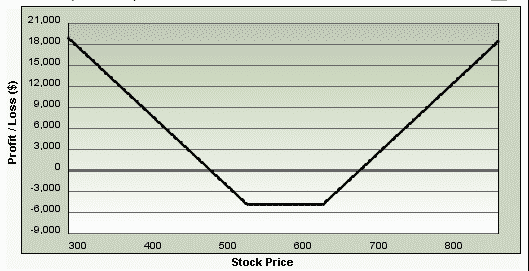
The first trade is a long strangle set up by buying and out-of-the-money call and an out-of-the-money put. When buying options you want to be at least 3-6 months out in time in order to reduce the effects of time decay.
Buy 1 October $625 call @ $23.00
Buy 1 October $525 put @ $26.00
Total Debit: $4,900
Delta: 8.67
Gamma: 0.64
Theta: -31.77
Vega: 244.67
If you wanted to neutralize the delta of +8.67 you would sell short 9 shares of AAPL.
The idea with this trade would be to sell it after 1-2 months (or earlier if we get a big move). You would not want to hold this to expiry, as you can see that AAPL would need to make a pretty big move in order to reach the breakeven points. Ideally with this trade you would want to see a big move and subsequent rise in implied volatility as soon as possible. Based on the AAPL chart, that could be a distinct possibility. A drop in implied volatility would hurt this trade.
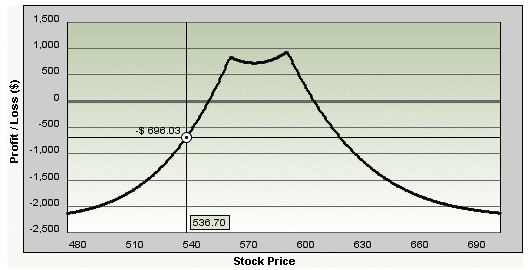
The other idea is a double calendar spread set up as follows:
Buy 1 August $590 Call @ $22.80
Sell 1 July $590 Call @ $11.95
Buy 1 August $560 Put @ $25.60
Sell 1 July $560 Put @ $14.20
Total Debit: $2,225
Delta: 2.18
Gamma: -0.54
Theta: 3.76
Vega: 50.13
With this trade, you’re hoping for a rise in implied volatility, but what you don’t want is a huge move in the stock. One difference between this trade and the long strangle is that time decay works in your favor with this trade. Like the long strangle, a drop in volatility will also hurt this trade.
I’ll update this post in a few weeks to see how the trades are working out.
What do you think of these two trade ideas? Is it something you would consider trying?


Yes, I use ivolatility for IV and HV. For the other greeks I use optionshouse P&L calculator
Did you mean “SELL 1 July $560 Put @ $14.20”? Or BUY?
yes, I meant Sell. Thanks for pointing that out, it’s fixed now.
Apple’s earnings report is the week after the july options expire so it will likely break out of the pattern that week so I don’t think I’d do the July trade. October will also fall just before earnings and the iphone will be announced earlier that month so the stock is likely to move big in October so the October trade could work out well. The July earnings rise in volatility could be enough to make that trade work.
Yeah earnings always throws a spanner in the works. I’ll post an update in a few weeks and see how each trade is doing.
good indea, about the straddle, how to neutrality negative theta?
thanks
You could use this in conjunction with iron condors with are positive theta