






In a little-known corner of nasdaq.com is the Nasdaq Dorsey Wright Research Hub (NDW for short).
Dorsey, Wright & Associates was founded by Tom Dorsey and Watson Wright in 1987 as a technical analysis firm that specializes in Point-and-Figure (P&F) charting, Relative Strength analysis, momentum investing, and rules-based portfolio construction.
In 2015, they were acquired by Nasdaq and now operates as a research division of Nasdaq under the name Nasdaq Dorsey Wright (NDW).
Their research centers on several technical disciplines:
- Point-and-Figure charting
- Relative Strength rankings
- Momentum investing
- Asset allocation models
- Technical ratings
Contents
- Hub Page
- Using NDW For Options Trade Ideas
- Pre-Made Screener
- Buy Lists
- What Does “Buy Signal On An X Column” Mean?
- Double Top Chart Pattern
- Stock Details And Pnf History
- Advanced P&F Charting
- Premium Features
- Relative Strength Matrix
- DALI Report
- Dashboards And Widgets
- NDW Screener
- FAQ
- How Can Options Traders Use The NDW Relative Strength Matrix?
- Final Thoughts
Hub Page
Its front hub page brings together some daily market commentary and articles, market indicators, and asset class research.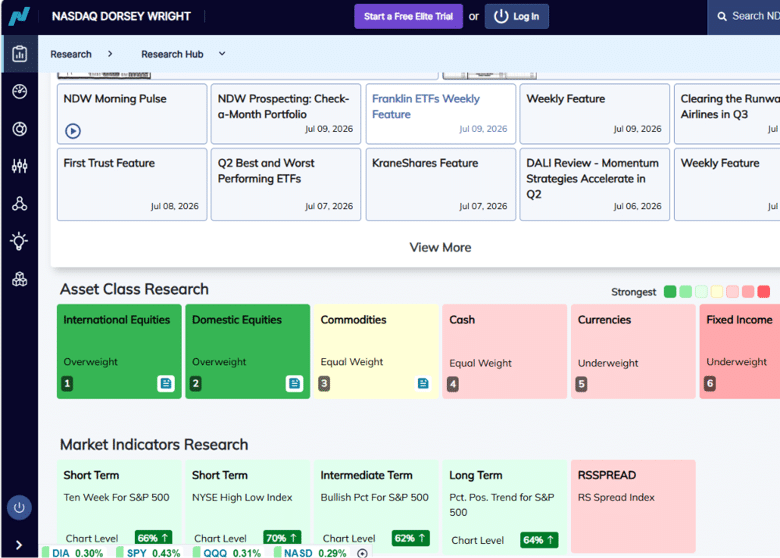
At NDW, they use the terminology overweight to indicate a bullish outlook, while underweight indicates a bearish outlook.
Equal Weight is neutral.
Exploring the left menu, many features display a lock-icon indicating they are premium tools that require a paid subscription.
The two primary free features are the Buy Lists and the Pre-Made Screener.
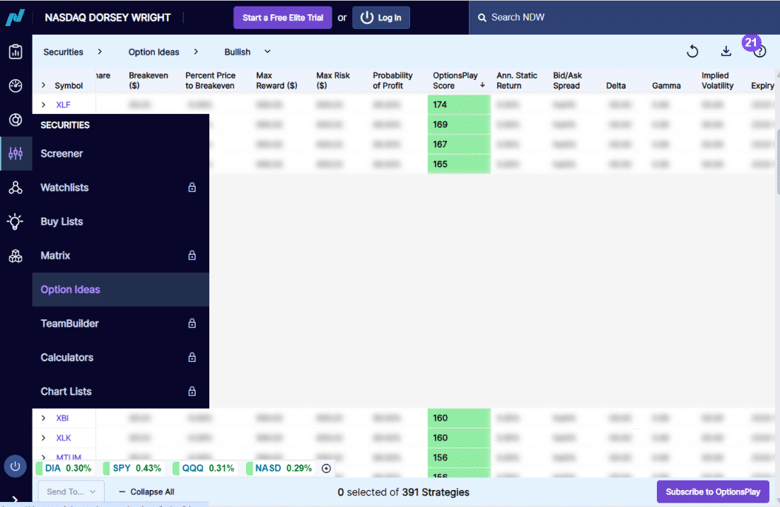
The Option Ideas section is also accessible, but most of its content is grayed out except for the OptionsPlay Score, which is sourced from OptionsPlay.
Using NDW for Options Trade Ideas
The Option Ideas section within NDW integrates OptionsPlay’s scoring system to combine NDW’s technical ratings with options-specific analysis.
The OptionsPlay Score rates each stock’s options setup based on the combination of technical trend, implied volatility level, and options liquidity — helping traders identify which technically strong stocks also have attractive options premium.
In practice, combining NDW’s technical ratings with options analysis works like this: use the Dorsey Wright Overweights screener or the Relative Strength Matrix to identify stocks with strong P&F buy signals and high Tech Attribute scores, then check the options chain for available premium.
A stock at the top of the relative strength ranking with elevated IV rank is a strong candidate for a bull put spread or covered call — you have both a technical and volatility-based rationale for the trade.
The PANW example from the Relative Strength Matrix illustrates this well.
A stock with 98/100 relative strength buy signals is clearly in a dominant uptrend — making it a logical candidate for a bull put spread positioned below key P&F support levels.
Pre-Made Screener
From the six pre-made screener to choose from…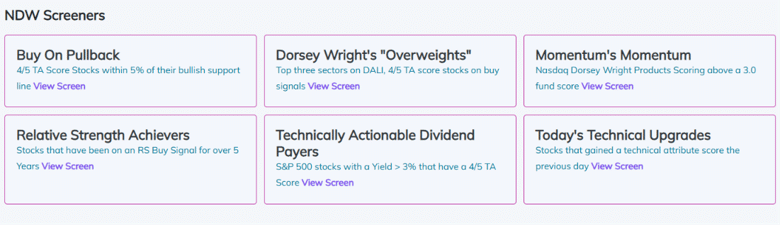 Clicking on Dorsey Wright’s Overweights screen, we get 213 stocks that have a high Technical Attribute score with buy signals on their point-and-figure charts and are in the top three best performing sectors.
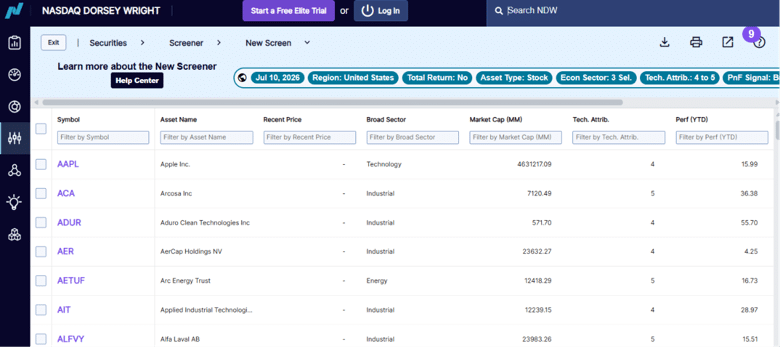 You might wonder why AAPL seems to show up on top a lot of the time.
That is because the list is sorted alphabetically by default.
Click on the Tech Attribute or the Perf column to sort by best performer.
Buy Lists
The Buy Lists show stocks with NDW’s Buy and Strong Buy ratings.
The stocks are grouped by sector, with the strongest sectors listed at the top.
As an example, we have expanded the Health Care sector of which there are 24 stocks with the NDW rating shown in the last column…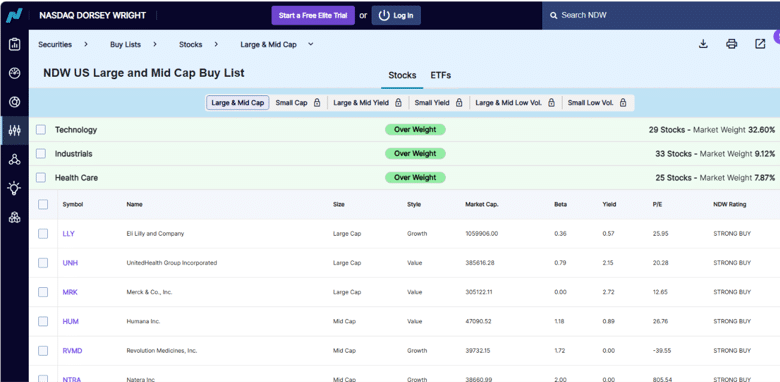 Note also that only the Large & Mid Cap tab is unlocked while the Small Cap is not available.
When we click on UNH stock, we see a detailed analysis page providing the Tech Attribute score that goes from 0 to 5 (with 5 being the best) based on trend and relative strength characteristics shown to the right of it.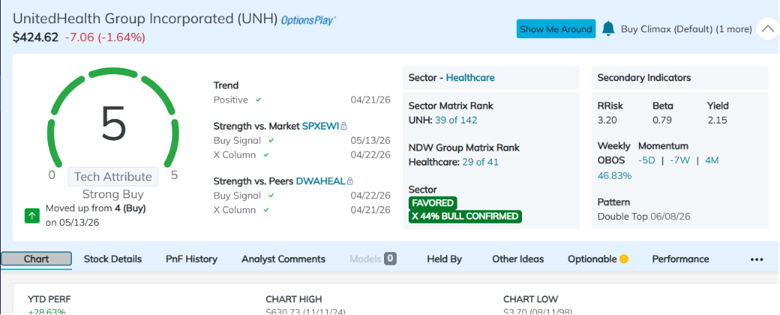 Relative strength is determined by the ratio of the stock’s price to the price of the market index or its peers.
If the ratio is rising, it indicates that the stock is outperforming.
This ratio is plotted on a Point & Figure chart for analysis.
In this example, we see the trend is positive.
Strength versus Market is in a buy signal on an X column.
Strength versus Peers is also in a buy signal on an X column.
What does “buy signal on an X column” mean?
The UNH details page shows the P&F chart of UNH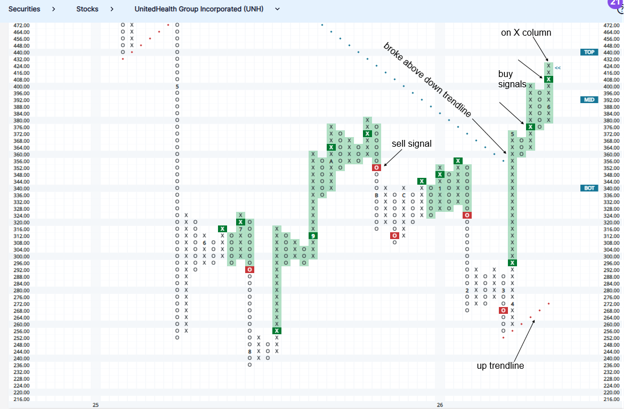 In a P&F chart, a column of X’s is an uptrend and a column of O’s is a downtrend.
Buy signal occurs when the last column of X’s exceeds the previous column of X’s, which is what the above chart shows.
Sell signal occurs when the last column of O’s drops below the previous column of O’s.
The buy/sell signal remains in effect until the opposing signal occurs.
UNH is currently in a buy signal.
Since the last column is an X column, it is still in an uptrend.
Buy signal on X column (abbreviated as “BX”) means stock is in a buy signal in an uptrend.
Buy signal on O column (abbreviated as “BO”) means stock is in a buy signal but in a pull back.
Similarly, “SO” is a sell signal in a downtrend.
“SX” is a sell signal in a rally.
Double Top Chart Pattern
In the Secondary Indicators section of the analysis page, it will indicate any point-and-figure pattern it finds.
UNH is currently showing a Double Top P&F pattern.
This is not the same as a candlestick double-top.
A double top in P&F means that the last X column is higher than the previous X column.
Stock Details And PnF History
Clicking on other tabs in the stock detail page, we can see further details…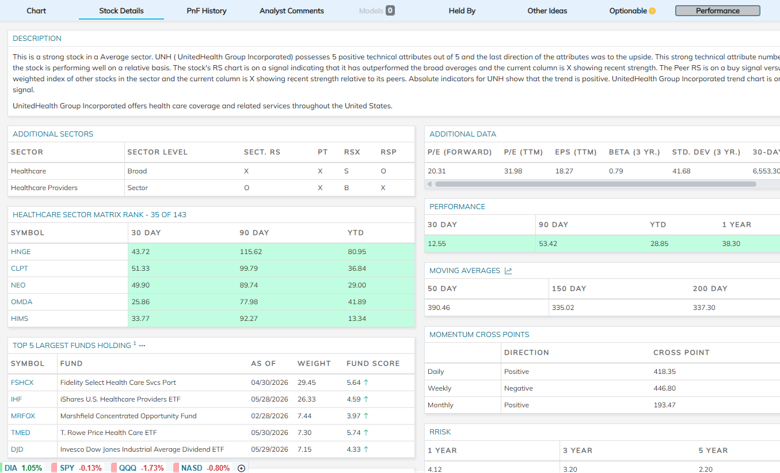 As well as its history of point-and-figure chart patterns that have occurred…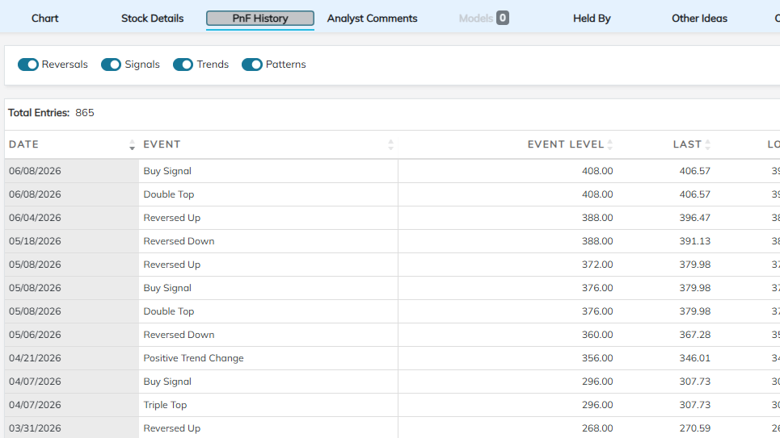
Advanced P&F Charting
NDW provides advanced Point-and-Figure charting where you can enter any symbol to analyze price trends and signals.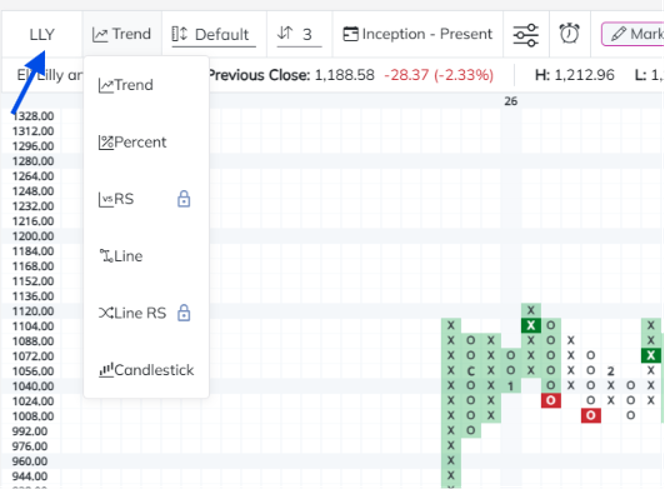
Premium Features
Let’s take a look at some of NDW’s premium features.
NDW does offer a limited-time free trial that does not require a credit card, making it easy to explore these advanced tools.
Upon doing so, we are able to switch to the RS (relative strength) chart types which were previously locked.
These charts allow you to plot the price ratio of one security against another using Point-and-Figure methodology.
This relative strength comparison is the foundation of how NDW identifies market leaders and laggards.
Plotting UnitedHealth Group (UNH) versus Eli Lilly (LLY), we see that UNH is underperforming LLY because we have a sell signal.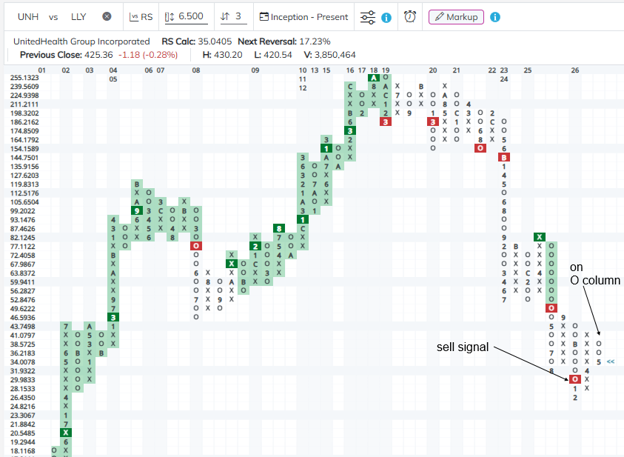 The chart is on an O column indicating that the price ratio of UNH / LLY is decreasing.
Relative Strength Matrix
The Relative Strength Matrix Tool under Security Selection compares multiple stocks versus one another at the same time on a relative strength basis and ranks them from best to worst based on the number of relative strength buy signals each accumulates.
You can create your own custom matrix, or start off with the predefined Nasdaq 100 matrix as an example…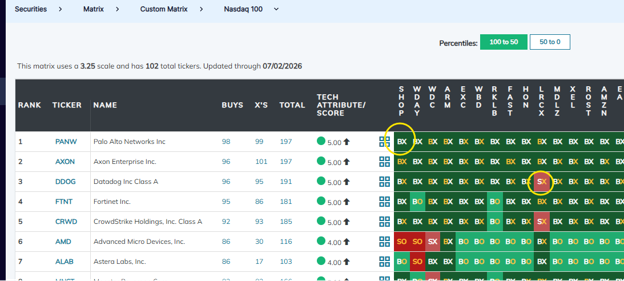 Just like how we had compared UNH with LLY, this matrix was formed by comparing each of the 100 stocks with the rest of the 100 stocks and looking at whether there was a buy/sell signal in the P&F chart of their price ratios.
For example, when DDOG (find in the left column) is compared with LRCX (find on top heading), there was a sell signal in the P&F chart indicating that DDOG is weaker than LRCX.
When PANW is compared with SHOP, there is a buy signal.
When PANW is compared with WDAY, there is a buy signal.
When PANW is compared with WDC, ARM, EXC, etc, all buy signals.
When compared with the other 100 stocks, PANW had 98 buy signals.
And in the 99 of relative strength P&F charts, the latest column was showing a rising column of X’s.
That is why PANW is listed at the top of the list with the highest aggregate score, along with its Tech Attribute score.
While NDW provides robust Point-and-Figure charting, you can also switch to candlestick charts for additional context.
Looking at the candlestick chart for PANW, we see a good looking chart…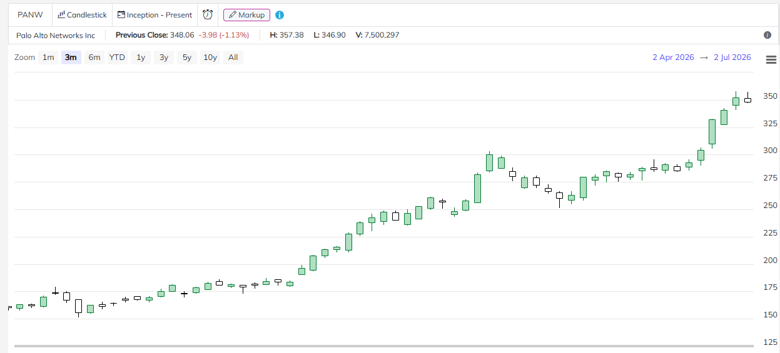 So this is a great way to find trade ideas based on relative strength.
You can reverse- sort to look for the most bearish stocks as well.
DALI Report
Using a top-down market approach, the Dynamic Asset Level Investing report ranks asset classes based on relative strength.
They use this report to overweight or underweight certain areas of the market.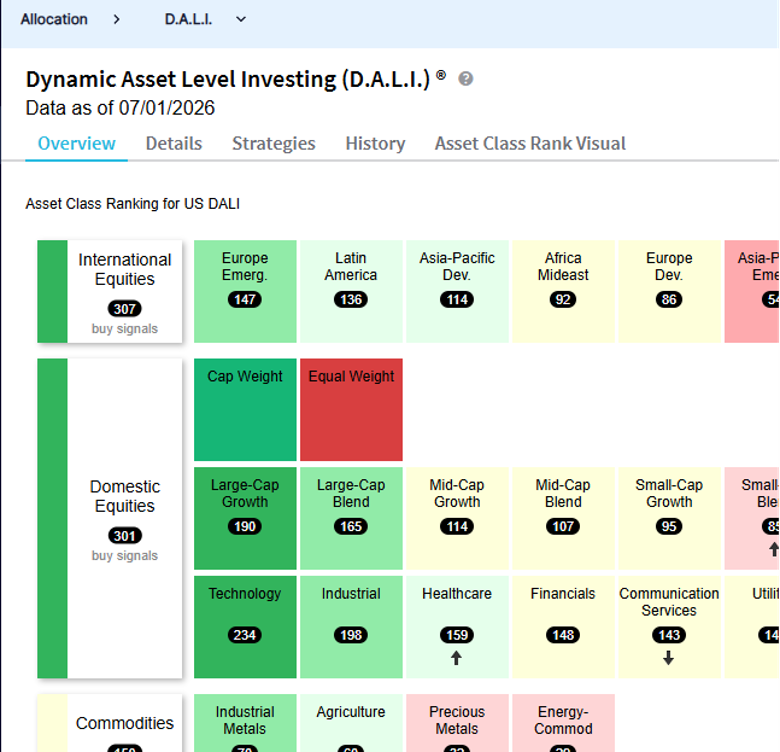
Their proprietary relative strength rankings use a combination of relative strength buy signals.
Dashboards And Widgets
NDW lets you customize and save multiple dashboards with various widgets, alerts, and watchlists…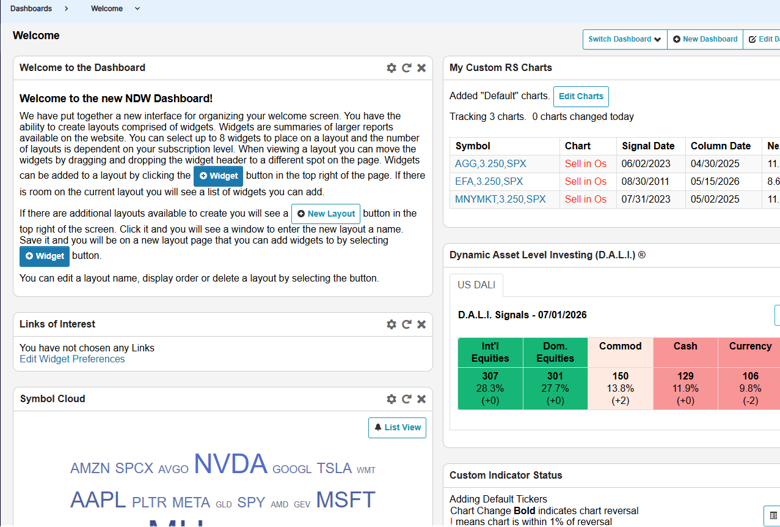 The Breakout Summary widget tells you which stock in the S&P 500 just got a new buy signal from the P&F charts…
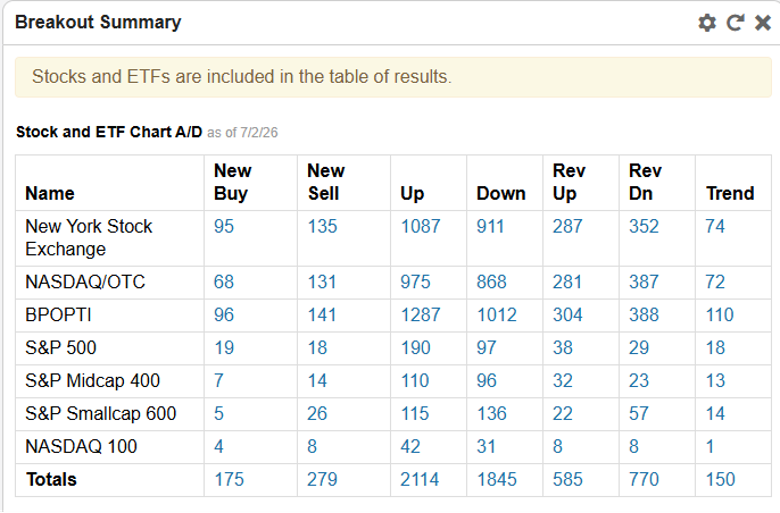 Clicking on the 19 S&P symbols with new buys, we find HOOD to have a technical score of 5 in a “P” (positive) uptrend…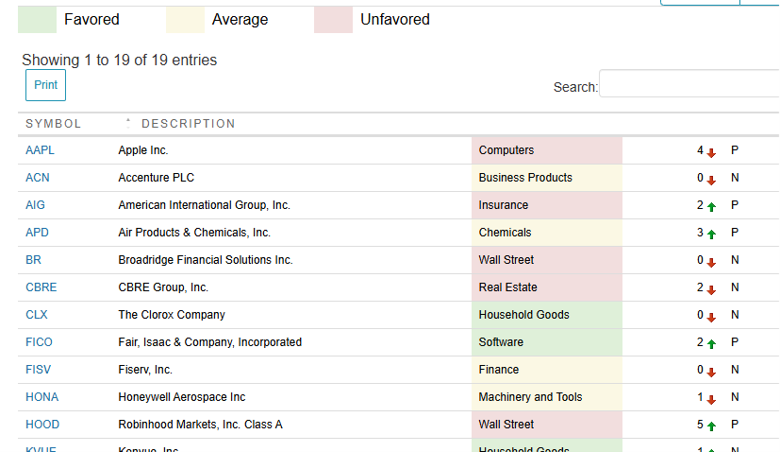
Clicking into the P&F chart of HOOD, we see that it is in a buy signal on X column…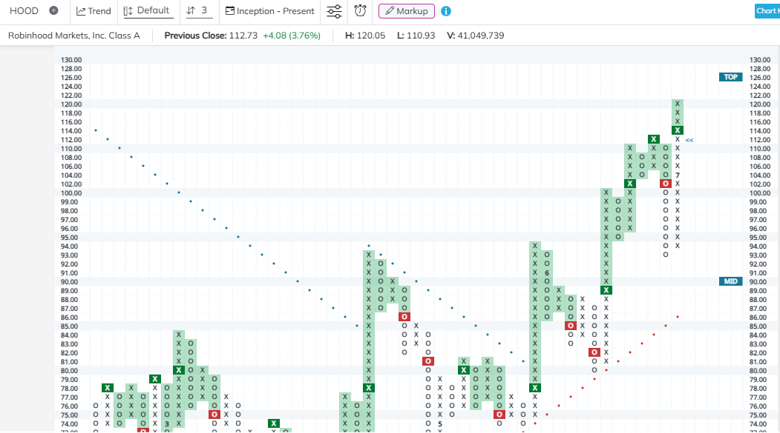
The New Patterns widget gives you stocks/ETFs making new P&F chart patterns…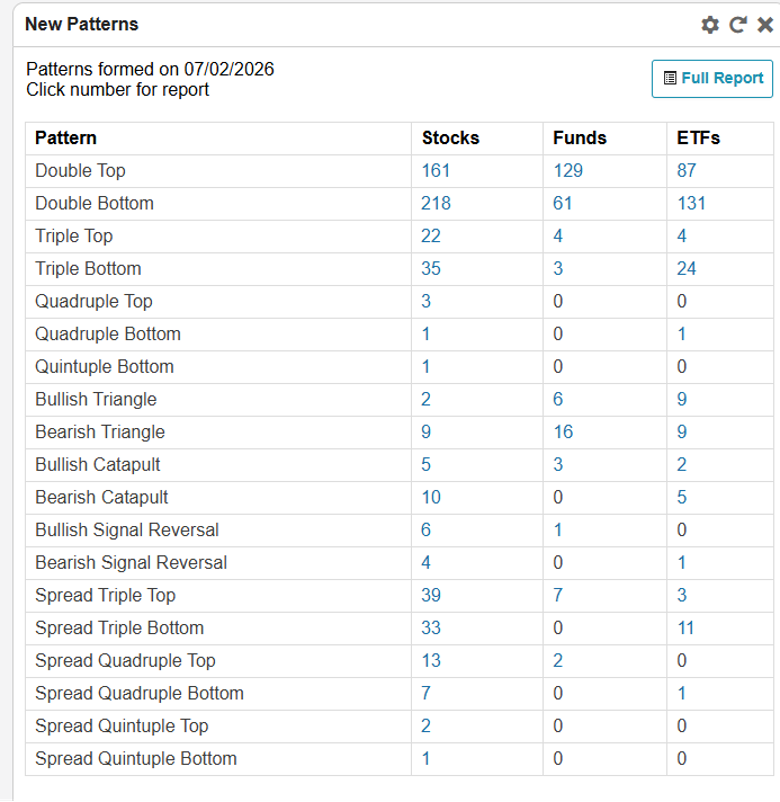 Clicking on the Double Top pattern, we see AAPL at near the top of the list again only because the list is alphabetical by ticker symbol.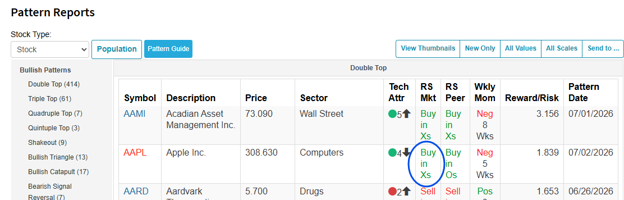
It is common to look for stocks with buy signal and currently in uptrend (denoted as “Buy in Xs”) plus a high (4 or 5) Tech Attribute score.
Clicking into the AAPL chart, we do see a double-top pattern with the last column of X exceeding the previous column of X’s.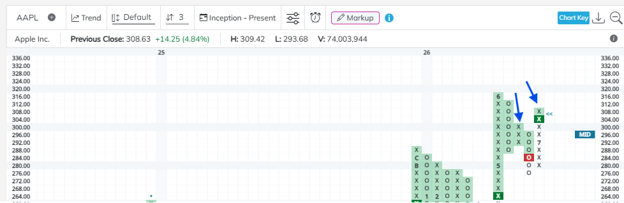
Looking at the triple bottom pattern, we find TER triggered a sell signal after breaking down through its support level of $415…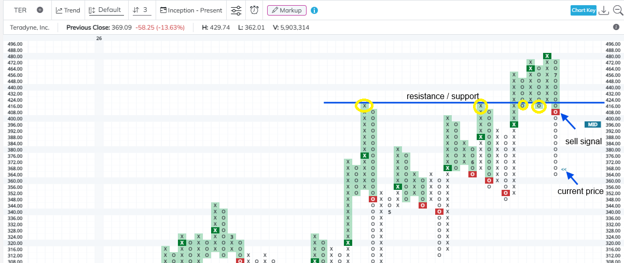
In the screenshot above, I added the blue line and yellow circles to illustrate how easy it is to identify support and resistance on a Point-and-Figure chart.
Resistance is formed when two columns of X’s peak at the same price level, while support is formed when two columns of O’s bottom at the same price level.
There is also the 52-week high’s and low’s widget…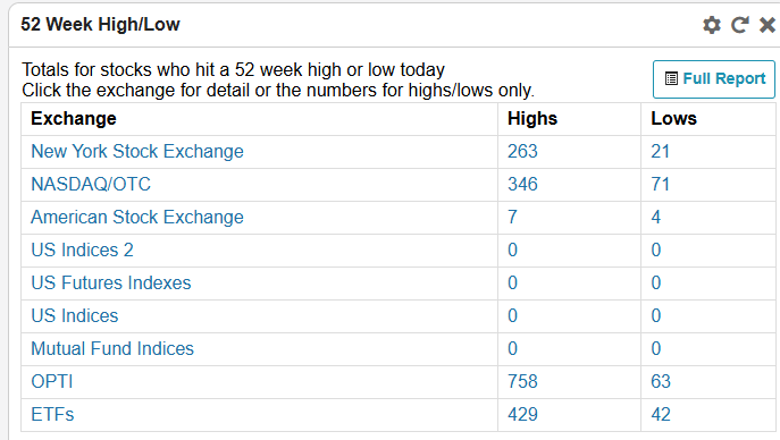 And many more widgets that you will need to explore on your own.
NDW Screener
With premium subscription, you get more than just the pre-made screens.
The NDW screener has a robust set of options which an AI prompt can help with setting up.
Here is an example screen for some large cap optionable stocks that have bullish trending P&F chart patterns with a buy signal and Tech Attribute score of 4 or 5…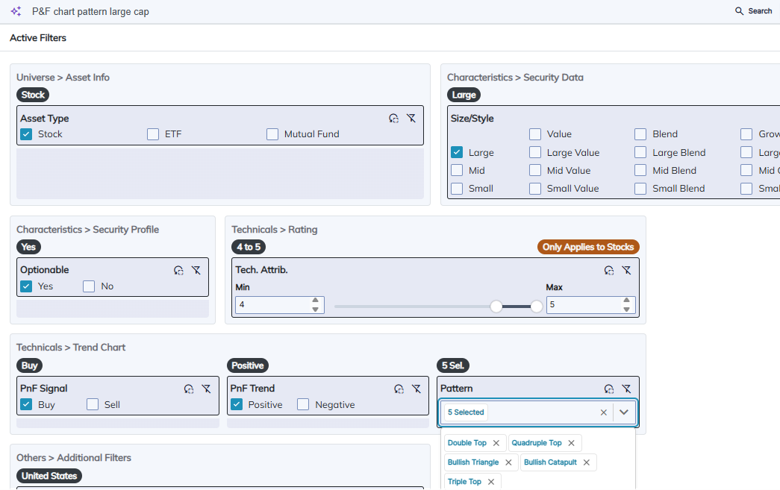
Want to Combine Technical Strength With Options Income Strategies?
Using tools like NDW to identify technically strong stocks is only half the equation.
Options Income Mastery covers the options side — exactly how to structure bull put spreads, covered calls, and iron condors on stocks with strong technical setups, with defined risk and consistent income generation.
Learn more about Options Income Mastery →
FAQ
Is The Nasdaq Dorsey Wright Research Hub Free?
Partially.
The Buy Lists, Pre-Made Screener, basic P&F charting, and the OptionsPlay Score within Option Ideas are all available for free without a subscription.
Premium features — including relative strength charts, the full Relative Strength Matrix, DALI report, advanced screener, and most dashboard widgets — require a paid subscription.
NDW does offer a limited-time free trial that does not require a credit card.
What Is A Tech Attribute Score on NDW?
The Tech Attribute score is NDW’s proprietary rating of a stock’s technical strength, scored from 0 to 5.
It is based on trend analysis and relative strength characteristics from Point-and-Figure charts.
A score of 4 or 5 indicates strong technical momentum — the stock is in an uptrend and outperforming its peers.
Most experienced NDW users filter for stocks with Tech Attribute scores of 4 or 5 when looking for trade candidates.
What Is The Difference Between A P&F Double Top And A Candlestick Double Top?
A candlestick double top is a reversal pattern where price reaches the same high level twice before declining — typically a bearish signal.
A P&F double top is a bullish breakout signal — it occurs when the current column of X’s exceeds the previous column of X’s, indicating buyers have pushed price to a new high above prior resistance.
The same term means opposite things on the two chart types, which is a common source of confusion for traders learning P&F analysis.
What Is The DALI Report?
DALI stands for Dynamic Asset Level Investing.
It is NDW’s proprietary top-down asset allocation report that ranks major asset classes (equities, fixed income, commodities, currencies, international markets) based on relative strength.
The report is updated regularly and used to overweight or underweight certain asset classes in a portfolio.
It is a premium feature but one of the more widely referenced outputs from the NDW platform among professional investors.
How Can Options Traders Use The NDW Relative Strength Matrix?
The Relative Strength Matrix ranks stocks by the number of relative strength buy signals they have versus their peers.
Stocks at the top of the matrix are clearly outperforming on a broad basis — making them natural candidates for bullish options strategies like bull put spreads, covered calls, or cash-secured puts.
Stocks at the bottom are consistent underperformers and can be candidates for bear call spreads.
Combining relative strength rankings with implied volatility analysis creates a robust framework for options trade selection that goes beyond pure price chart analysis.
Final Thoughts
Because Nasdaq Dorsey Wright is built around Point-and-Figure analysis, learning to read P&F charts will help you get the most value from the platform and better understand its ratings and investment models.
One resource is Tom Dorsey’s book Point and Figure Charting: The Essential Application for Forecasting and Tracking Market, which is widely regarded as a definitive guide in this subject.
For investors who appreciate Dorsey Wright’s disciplined, rules-based approach to combining Point-and-Figure charting with relative strength investing, numerous Dorsey Wright–branded ETFs are available.
These funds apply their proprietary methodologies to various major asset classes.
We hope you enjoyed this introduction to the Nasdaq Dorsey Wright Research Hub.
If you have any questions, please send an email or leave a comment below.
Trade safe!
Disclaimer: The information above is for educational purposes only and should not be treated as investment advice. The strategy presented would not be suitable for investors who are not familiar with exchange traded options. Any readers interested in this strategy should do their own research and seek advice from a licensed financial adviser.