





We typically don’t hear about the CBOE 1-Month Implied Correlation Index (also known as the COR1M) because it normally doesn’t give us that much interesting information, except when it reaches an extreme.
And it reached one such extreme on June 2nd, 2026.
Let’s see what happened.
The COR1M does not appear on the nightly news alongside the Dow Jones or the S&P 500.
It rarely surfaces in mainstream financial commentary.
Even if a television analyst was to explain the COR1M as a measure designed to quantify the spread between the SPX index implied volatility and the average single-stock basket component implied volatility by using the one-month at-the-money options, the viewer might just scratch their heads and switch the channel.
Contents
- What COR1M Actually Measures
- What A Very Low COR1M Tells Us
- Low COR1M Signals Caution
- Spike In Correlation
- What Low COR1M Means For Options Traders
- FAQ
- Conclusion
What COR1M Actually Measures
In plain language, the index attempts to answer a simple question: are the largest stocks in the market moving together, or are they each dancing to their own tune?
A high correlation index means that they are moving together.
A low correlation index means their price movements are not correlated.
Correlation, in financial terms, measures the degree to which assets move in the same direction at the same time.
A high correlation means every stock rises and falls in perfect lockstep.
A low reading mean each stock is essentially moving independently, driven by its own company-specific news, earnings, and fundamentals rather than by broad market forces.
A well-established rule of thumb among analysts is that correlations increase during market downdrafts and decrease during steady rallies.
This dynamic creates a logical and well-documented relationship between the two measures.
In calmer, more fundamentally driven markets, macro anxiety recedes and investors regain confidence in individual company analysis.
Stocks begin responding to their own earnings, their own management decisions, their own competitive dynamics.
The index stays relatively calm while individual stocks display lively and idiosyncratic movement.
COR1M falls, sometimes dramatically, as a reflection of that divergence.
What A Very Low COR1M Tells Us
On June 2nd, 2026, the COR1M index closed on a very low value of 5.86.
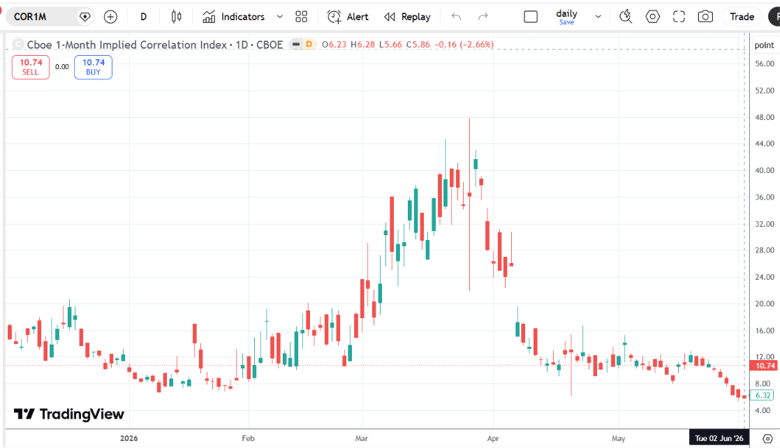
The index is essentially sitting at the floor of what is historically observed, signaling an environment of extreme stock-level divergence and minimal index-level fear.
The last time the index closed at a comparably low level was in mid-July 2024, nearly two years ago, when the COR1M fell to 2.93 on July 12, 2024.
When COR1M reaches historically low levels, it carries several distinct and important messages for investors and traders who know how to read it.
The first and most intuitive message is that the market has entered what practitioners call a stock picker’s environment.
Realized correlation tends to be lower in periods of calm in the market because during these times, stock picking is more present while macro factors and sentiment take a back seat.
When stocks are moving independently rather than in unison, the quality of individual company analysis matters enormously.
An investor who identifies a genuinely undervalued company, or correctly forecasts a specific firm’s earnings trajectory, stands to be rewarded in a low-correlation regime in a way that simply is not possible when everything rises and falls together.
Conversely, poor stock selection is punished more harshly because there is no broad tide lifting all boats.
From the start of the year through June 2nd 2026, market leadership was concentrated primarily in the technology (XLK) and energy (XLE) sectors, while most other sectors lagged behind.
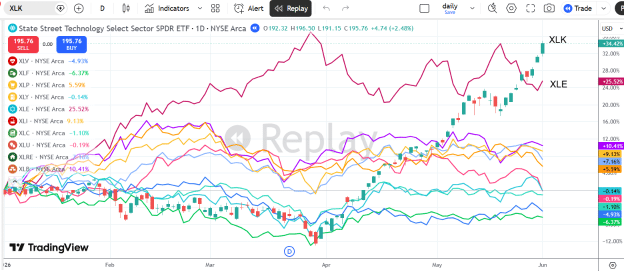
Source: tradingview
While the technology sector is up 30% in 6 months, the percentage of S&P 500 stocks above its 50-day moving average is only 60%.
This narrow market participation and extreme performance divergence left COR1M near its long-time lows.
The index itself was calmly marching higher while beneath the surface, the average stock was not participating.
High dispersion and low correlation were the defining characteristics of that regime.
Low COR1M Signals Caution
Another implication of an extreme low in COR1M is more cautionary in nature.
Very low readings are, by definition, unusual and therefore temporary.
Markets tend to revert toward their long-term correlation averages over time.
A reading deep in historic-low territory means the market is pricing in an exceptionally benign environment where individual stocks will continue to behave independently and macro forces will remain subdued.
That assumption can be shattered quickly by a single large macro shock: a surprise inflation print, a geopolitical crisis, a systemic banking event, or a shift in Federal Reserve policy, etc.
When such events occur in a low-correlation environment, the reversal can be violent, because correlation snapping back toward 1.0 from extreme lows is the structural definition of a broad market selloff.
For the active trader and the institutional portfolio manager, COR1M is a signal that tells them that index options are likely offering relatively inexpensive portfolio insurance compared to the volatility actually present in individual names.
And it tells them, with the quiet insistence of a warning light that has not yet triggered an alarm, that the market’s current state of calm divergence will not last indefinitely.
Spike In Correlation
That same week on Friday, June 5th, 2026, the COR1M could no longer stay at 6 and spiked up to 14 points…
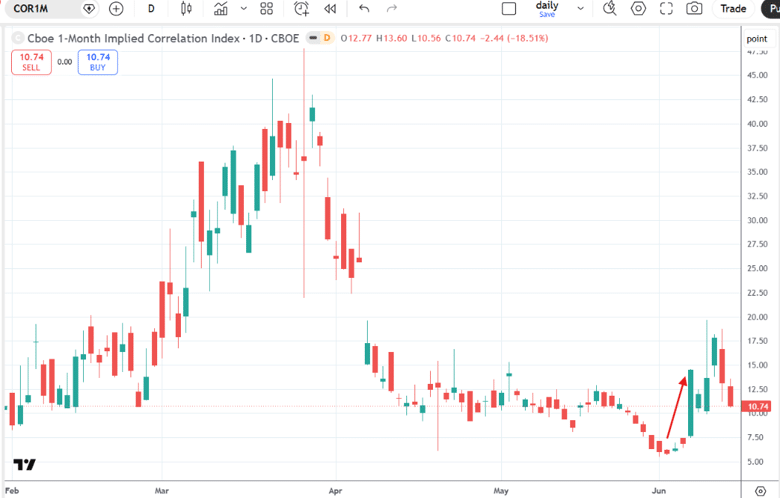
This was accompanied by the SPX dropping 200 points in one day from close to close (or down 2.6%).
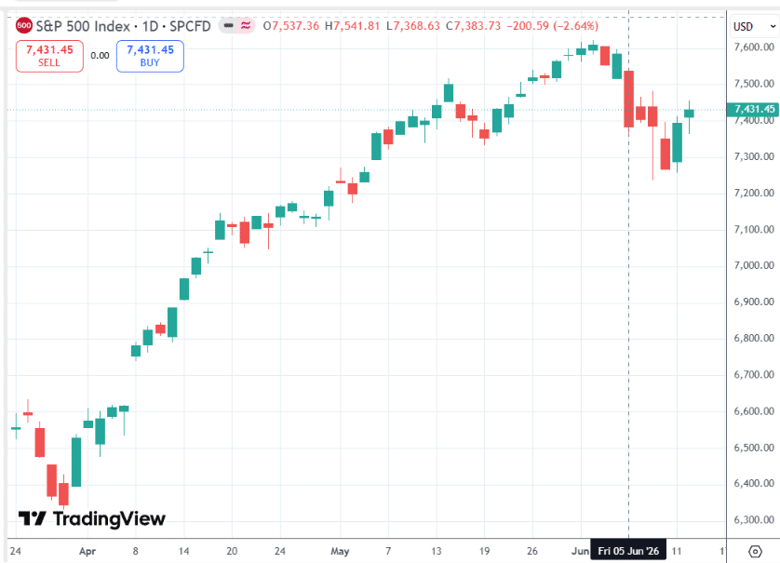
When markets are in crisis, fear tends to be indiscriminate.
Investors sell broadly, institutions reduce risk exposure across the board, and individual stocks get swept up in a collective wave of selling regardless of their individual fundamentals.
In those moments, COR1M rises sharply alongside the VIX.
In many ways, the COR1M seems to mirror the more widely viewed VIX index.
Here is a side-by-side comparison with COR1M on top and VIX on the bottom chart…
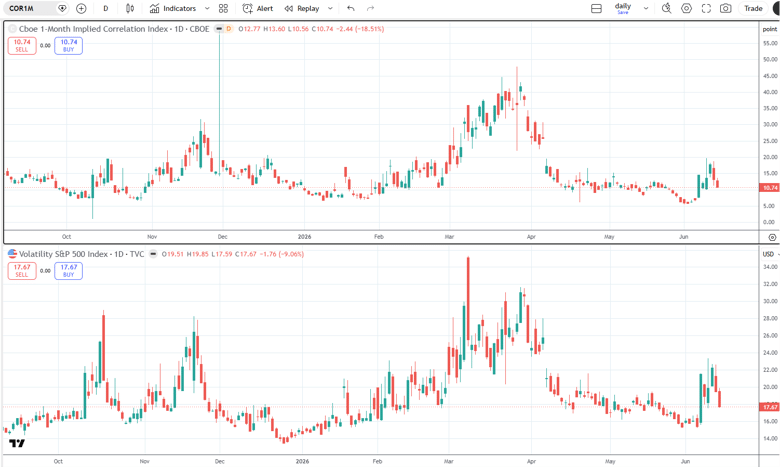
The 2008 financial crisis, the COVID crash of March 2020, and the sharp selloff of early 2022 all produced spikes in implied correlation because the market was behaving as one large, undifferentiated entity being moved by a single dominant force.
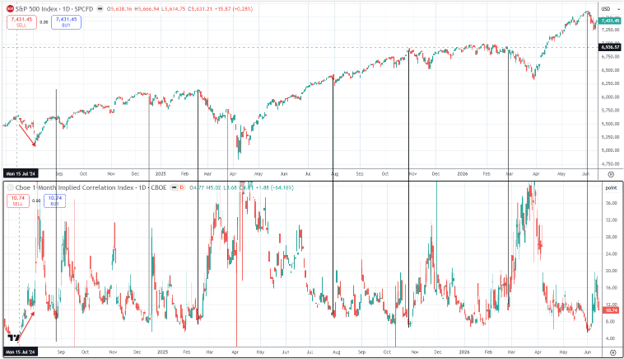
The previous COR1M low on July 12th, 2024 led to a sharp sell-off in the SPX a few days later.
Although the relationship is far from perfect, a recurring pattern appears to be that major market selloffs are often preceded by low COR1M values.
Here we have the SPX chart on top and the COR1M chart at the bottom…
What Low COR1M Means For Options Traders
For options traders, the COR1M signal has two specific practical implications.
Single-stock volatility is likely underpriced by the index.
When COR1M is very low, implied volatility on the SPX index is lower relative to the individual components than it typically is.
This means that single-stock options, particularly on names with strong independent price drivers, may carry more volatility premium than index options.
Selling options on individual high-volatility names like NVDA, AMZN, or GOOGL in a low-correlation environment is, in structural terms, more attractive than selling SPX index options at the same delta.
Index protection is relatively cheap.
The flip side of the same dynamic: when correlation is low and the VIX is subdued, buying portfolio protection via SPX puts is comparatively inexpensive.
A trader who has identified that COR1M is near historic lows, and who knows from experience that mean reversion can be swift and violent, may consider adding defined-risk downside protection through SPX put spreads or longer-dated SPX puts while the premium is still affordable.
The June 5th spike from 6 to 14 in a single session, accompanied by a 2.6% SPX drop, illustrates exactly how quickly that protection window can close.
For iron condor traders specifically, a low COR1M is a useful warning signal.
Iron condors on the broad index profit from the market staying in a range — but if low correlation is signalling that macro calm is temporarily masking underlying fragility, the risk of a sudden violent move through your short strikes is elevated even if the surface appears calm.
This is not a reason to stop trading condors, but it is a reason to use wider strikes and smaller position sizes until correlation normalises.
FAQ
What Is A Normal Range For The COR1M Index?
The COR1M typically trades between 20 and 60 under normal market conditions.
Readings below 15 indicate unusually low correlation — a stock picker’s environment where individual company factors dominate.
Readings above 70 indicate a fear-driven market where everything is moving together.
Extreme readings in either direction tend to be temporary and tend to revert toward the long-term average.
Is The COR1M The Same As The VIX?
No.
They measure different things, though they often move in the same direction.
The VIX measures expected volatility of the S&P 500 as a whole.
The COR1M measures the degree to which the individual stocks within the S&P 500 are expected to move together.
A low VIX combined with a low COR1M means the index is calm and stocks are moving independently.
A high VIX combined with a high COR1M means the market is in a fear-driven, highly correlated selloff.
Where Can I Find The COR1M Index?
The COR1M index is published by the CBOE.
It can be found on the CBOE website under their suite of volatility indices, on Bloomberg terminals, and on some advanced retail platforms.
It is not widely available on standard retail charting tools like TradingView without a data subscription, which is part of why it receives little mainstream attention.
How Should Options Traders Use The COR1M?
The COR1M is best used as a background context indicator rather than a precise timing tool.
Very low readings suggest that single-stock options may offer better risk/reward than index options, and that market-wide portfolio protection is relatively inexpensive.
Very high readings suggest a fear-driven environment where selling premium on volatile individual names carries higher risk than the delta alone would suggest.
Use it alongside IV rank, VIX levels, and technical structure, not in isolation.
Want to Trade With Volatility Intelligence?
Understanding indicators like COR1M, VIX, and implied volatility rank is what separates systematic income traders from those who react to the market rather than anticipating it.
Options Income Mastery covers how to integrate volatility signals into a complete income trading process — including when to trade, how much to size, and when to reduce exposure.
Conclusion
The COR1M is not a predictor.
A low COR1M does not necessarily mean that a market sell-off is imminent.
Rather, it suggests that investors may be becoming overly complacent and that market leadership is becoming increasingly narrow.
Extremely low readings often occur when a small number of stocks or sectors are driving most of the market’s gains, while the broader market lags behind.
Such conditions can persist for weeks or even months, but they can also leave the market more vulnerable to unexpected shocks if leadership begins to falter.
In that sense, it can be viewed as a contrarian indicator.
We hope you enjoyed this article on the COR1M index.
If you have any questions, please send an email or leave a comment below.
Trade safe!
Disclaimer: The information above is for educational purposes only and should not be treated as investment advice. The strategy presented would not be suitable for investors who are not familiar with exchange traded options. Any readers interested in this strategy should do their own research and seek advice from a licensed financial adviser.