





Contents
- Bull Call Debit Spread
- Synthetic Option Equivalents
- Collar One Month Later
- Debit Spread One Month Later
- Collar At Expiration
- Debit Spread At Expiration
- BIL ETF
- Summary
Essentially, yes.
They are equivalent as long as you take into account the cost of carry and dividends.
Here’s a typical options collar on Apple (AAPL).
Date: Jan 23, 2026
Price: AAPL @ $245.93
Sell to open one contract April 17th AAPL $250 call @ $11.32/share
Buy 100 shares AAPL @ $245.93/share
Buy to open one contract April 17th AAPL $240 put @ $9.10/share
Net Debit: -$24,371
It involves buying 100 shares, taking a long put option for downside protection, and selling a call option to collect credit, helping reduce the cost.
The risk graph shows this trade’s limited downside with a capped upside.
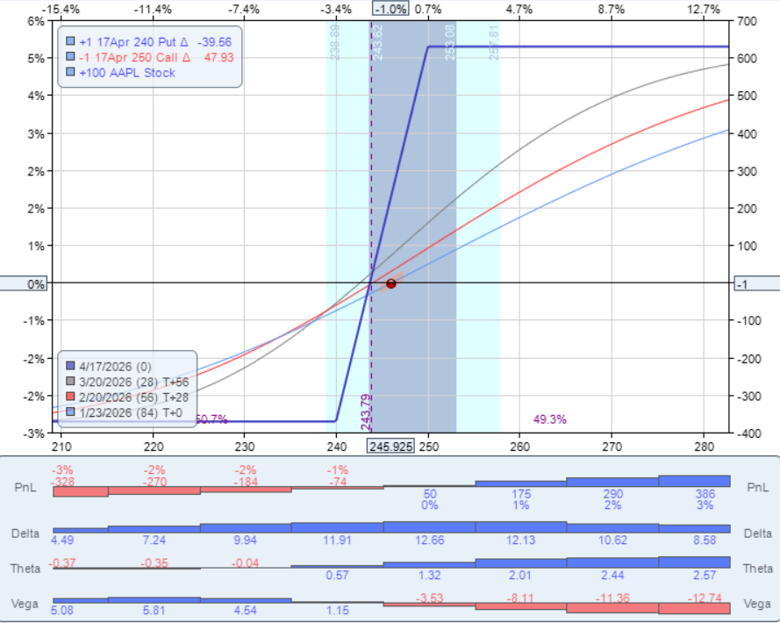
Max reward: $25,000 – $24,371 = $629 (stock gets called away at $250/share)
Max risk: -$24,371 + $24,000 = -$371 (because the put option guarantees that we can sell our shares at $240/share)
Delta: 12.51
Theta: 1.01
Vega: -1.56
The collar is one of the most popular defensive strategies among stock investors.
By owning the shares outright, the investor participates in any upside up to the short call strike, while the long put provides a hard floor on losses.
This combination of capped upside and limited downside gives the collar its characteristic flat-topped, flat-bottomed risk profile.
One often-overlooked advantage of the collar is its positive theta.
Unlike a debit spread, which has negative theta and loses value over time, the collar benefits from time decay because the short call decays faster than the long put in most market conditions.
This makes the collar particularly attractive for investors who want to hold a stock position while collecting some premium income along the way.
Bull Call Debit Spread
The above risk graph looks similar to a bull call debit spread placed at the same time with the same strikes and expiration:
Date: Jan 23, 2026
Price: AAPL @ $245.93
Sell to open one contract April 17th AAPL $250 call @ $11.32/share
Buy to open one contract April 17th AAPL $240 call @ $16.92/share
Net Debit: -$560
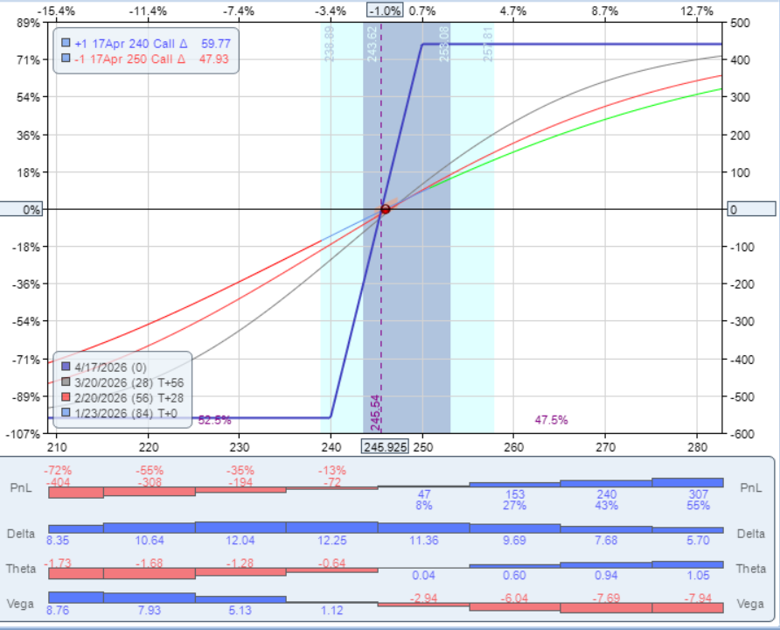
Max reward: $1000 – $560 = $440 (width of the spread minus the debit paid)
Max risk: -$560 (the max risk is the initial debit paid)
Delta: 11.84
Theta: -0.23
Vega: -1.35
It looks similar, but not exactly.
Also, the option Greeks are not identical.
The delta values are close but not identical: 12.51 for the collar versus 11.84 for the debit spread.
The difference arises because the collar holds actual shares with a delta of 1.00 per share (100 delta total), offset by the short call and partially offset by the long put.
The debit spread expresses a similar directional view purely through options.
When the share delta and the put and call deltas are combined and adjusted for the cost of carry, they converge toward the same net delta, but the path to get there differs.
The theta comparison is particularly informative.
The collar shows a positive theta of 1.01, meaning the position gains approximately $1.01 per day.
The debit spread shows a slightly negative theta of -0.23, meaning it loses a small amount of value each day from time decay alone.
This difference reflects the fact that the collar benefits from the short call decaying while the shares and long put hold their intrinsic value.
The vega figures are similar, with both positions short vega, meaning a rise in implied volatility works against the holder in either case.
The collar has more positive theta than the debit spread with time working in its favor.
The collar has a higher potential reward and lower max risk, and hence a better reward-to-risk ratio.
Collar reward-to-risk: $629 / $371 = 1.70
Debit spread reward-to-risk: $440 / $560 = 0.79
The collar also captures the $0.26 per-share dividend if held till the February 9, 2026, ex-dividend date, whereas the debit spread receives no dividend.
It seems the collar is superior in nearly every aspect except for its heavy capital requirement.
The debit spread’s only real advantage is its lower use of capital, which results in a higher percentage yield.
For a stock investor who already holds shares, the collar may be the more natural choice.
Rather than selling the stock, buying a call, and buying a put to reconstruct the debit spread, the investor simply overlays the options onto an existing position.
Transaction costs are lower, and the tax treatment of the underlying stock position is preserved.
The debit spread, by contrast, suits a trader who does not want to commit the full capital required to own 100 shares.
With only $560 at risk, the debit spread allows a trader to express the same directional view on AAPL with a fraction of the capital, accepting a lower absolute dollar return in exchange for a much higher percentage return on capital deployed.
This makes debit spreads especially attractive for smaller accounts or for traders who want to diversify across multiple positions without tying up a large block of capital in a single trade.
Synthetic Option Equivalents
According to option-synthetic theory, a combination of a stock and a long put is equivalent to a long call.
Therefore, if we substitute the stock and put option that’s in the collar with a single long call to produce the equivalent debit spread, the two trades should be identical.
Why are they not?
The higher the interest rate and the longer the trade duration, the more pronounced the difference is.
That is because the risk graph and the option analytic modelling did not take into account the cost of carry and the stock dividends.
If we account for those, the two investors will end up with the same amount.
For these two trades to be equivalent, the option investor must place their unused capital in a risk-free U.S.
Treasury bond, which yielded about 3.68% per year at that time.
This equivalence is rooted in put-call parity, one of the foundational principles of options pricing.
Put-call parity states that for European-style options on the same underlying with the same strike and expiration, the price relationship between a call, a put, the underlying stock, and a risk-free bond must hold precisely.
If it does not, arbitrageurs will immediately exploit the discrepancy and force the prices back into alignment.
In the context of a collar versus a debit spread, the equation works as follows: owning 100 shares plus a long put plus a short call (the collar) is equivalent to owning a long call plus a short call at a higher strike (the debit spread) plus a bond investment equal to the present value of the lower strike.
The bond represents the debit spread investor’s unused capital earning the risk-free rate.
Both sides of this equation produce the same profit and loss at every possible price at expiration, provided interest and dividends are properly accounted for.
In practical terms, this means the choice between a collar and a debit spread is largely a matter of capital efficiency and personal preference rather than of edge.
The collar requires more capital upfront but captures dividends and carries positive theta.
The debit spread requires far less capital but forgoes dividends and has slightly negative theta.
Understanding this equivalence helps traders choose the structure that best matches their capital situation, tax considerations, and outlook on the underlying.
Therefore, the option investor must place $23,811 in U.S.Treasuries or equivalents to match the collar investor’s capital usage.
The $23,811 is derived from $24,371 – $560.
Over 84 days in the trade, the interest would amount to $202.
0.0368 x $23,811 x 84 / 365 = $202.
That is $202 of guaranteed risk-free money for the debit spread investor.
If we increase the debit spread trade’s maximum potential reward by $202 and decrease its maximum loss by $202, we get a similar reward-to-risk ratio to the collar investor.
Debit spread reward-to-risk accounting for risk-free interest: $642 / $358 = 1.79
Collar One Month Later
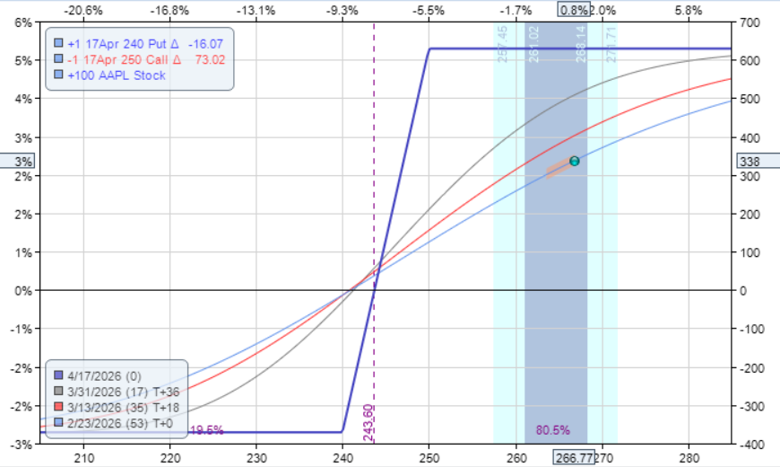
Let’s see the results of these two trades if the investor exits after one month.
Collar investor after one month:
Initial trade debit: -$24,371
Buy to close one contract April 17th AAPL $250 call @ $22.37/share
Sell 100 shares AAPL @ $266.77/share
Sell to close one contract April 17th AAPL $240 put @ $2.70/share
Dividend collected: $0.26/share
Net P&L: -$24,371 – $2,237 + $26,677 + $270 + $26 = $365
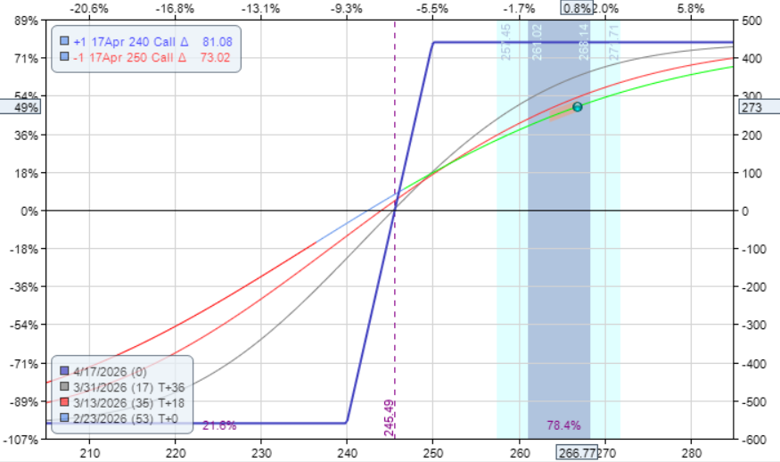
Debit Spread One Month Later
Initial trade debit: -$560
Buy to close one contract April 17th AAPL $250 call @ $22.37/share
Sell to close one contract April 17th AAPL $240 call @ $30.70/share
US Treasury return after one month: $73 (from 0.0368 x $23,811 / 12)
Net P&L: -$560 – $2237 + $3070 + $73 = $346
These calculations use idealized mid-point option prices.
Accounting for the bid/ask spread and slight price variance, the two investors are about the same after one month, with $365 versus $346 in profits.
Collar At Expiration
Let’s look at the two trades at expiration.
AAPL closed at $270.23 at expiration.
Hence, 100 shares are sold at $250/share.
The net P&L at expiration would be.
Initial trade debit: -$24,371
Sell 100 shares AAPL @ $250/share
Dividend collected: $0.26/share
Net P&L: – $24,371 + $25,000 + $26 = $655
Debit Spread At Expiration
The debit spread reached maximum profit with both the short and long calls in the money.
Initial trade debit: -$560
Assigned short $250 call obligated to sell 100 shares at $250/share
Exercise long $240 call to buy 100 shares at $240/share
US Treasury return after one month: $202
Net P&L: -$560 + $25,000 – $24,000 + $202 = $642
Again, this is close enough: $655 versus $642.
The figure on the risk-free interest of $202 is idealized.
In practice, retail investors may not receive the exact risk-free rate, as it may fluctuate slightly over the trade.
BIL ETF
What if the debit spread investor invested the $23,811 in the BIL ETF instead of direct U.S. Treasuries?
Holding BIL from January 23rd to April 17th:
Jan 23rd: Buy 260 shares of BIL at $91.59: -$23,813
Apr 17th: Sell 260 shares of BIL at $91.55: $23,803
Ex-dividend date Feb 2nd with $0.274/share: $71.24
Ex-dividend date Mar 2nd with $0.243/share: $63.18
Ex-dividend date Apr 1st with $0.264/share: $68.64
Net interest earned from BIL: $193.06
The interest earned from BIL ($193.06) is slightly less than that of U.S. Treasuries ($202) due to the management fee expense ratio.
The BIL example illustrates an important practical point: the theoretical equivalence between a collar and a debit spread assumes the investor earns exactly the risk-free rate on their uninvested capital.
In practice, this is an approximation.
Retail investors may earn slightly less than the theoretical rate depending on their brokerage account type, cash sweep options, and prevailing money market rates at the time of the trade.
Each leg of either position also introduces a bid/ask spread cost, so the collar’s three-leg structure will tend to have slightly higher transaction costs than the debit spread’s two-leg structure.
Summary
The comparison between a collar and a bull call debit spread is a useful exercise in options put-call parity and the role that interest rates and dividends play in pricing.
While the two structures look different on the surface, they are economically equivalent once you properly account for the opportunity cost of capital.
The real-world examples in this article show that the divergence narrows to less than 5% once risk-free interest and dividends are included, confirming that the equivalence holds in practice, not just in theory.
A long call is synthetically equivalent to 100 shares combined with a long put.
It follows that substituting the stock and put option in a collar with a single long call should make the collar and the bull call debit spread equivalent positions.
If it were not, then there would be an arbitrage opportunity.
An arbitrage opportunity means free money.
And we know that there is no free money unless, of course, you find a $20 bill on the sidewalk.
But then that free money does not last long.
We hope you enjoyed this article on collar vs debit spread.
If you have any questions, send an email or leave a comment below.
Trade safe!
Disclaimer: The information above is for educational purposes only and should not be treated as investment advice. The strategy presented would not be suitable for investors who are not familiar with exchange traded options. Any readers interested in this strategy should do their own research and seek advice from a licensed financial adviser.