


Here are some of the key charts I’m currently watching.
TEAM
Nice breakout above resistance at $155. Maybe it comes back to retest, but that prior resistance level should become support.
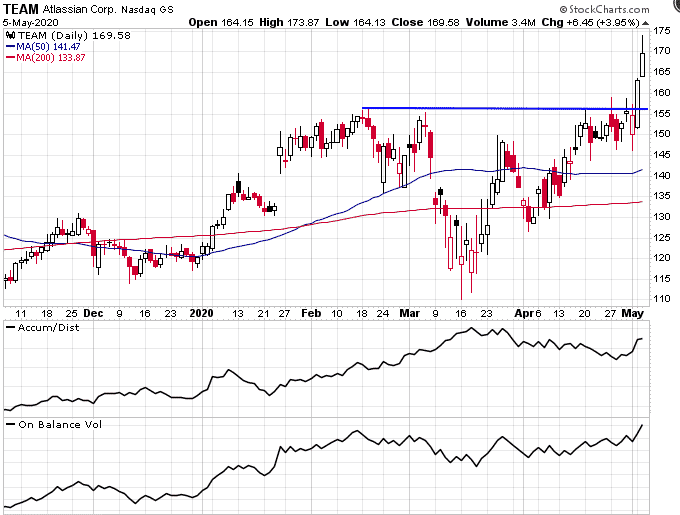
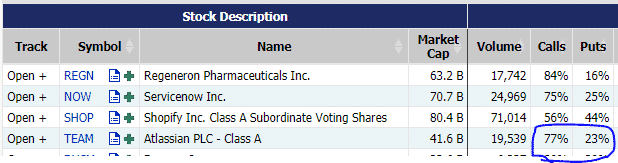
Lots of call volume as well.
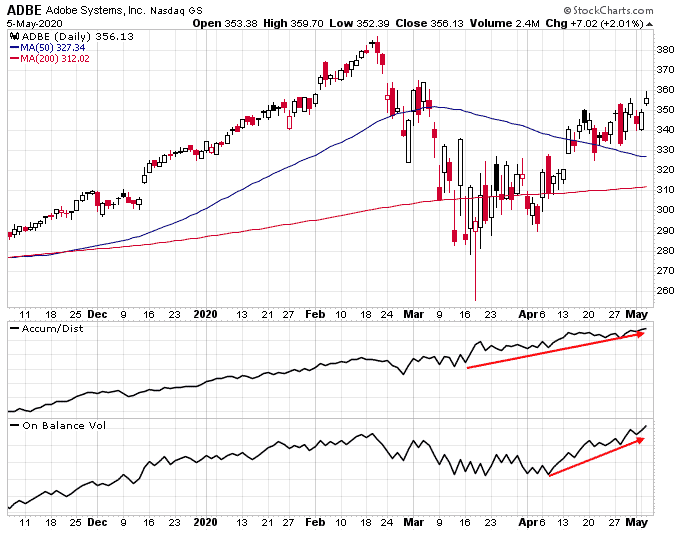
ADBE
Looks very bullish. Above the moving averages, breaking out to a new high with rising accumulation and on balance volume. Looks like it wants to head to $385 again.
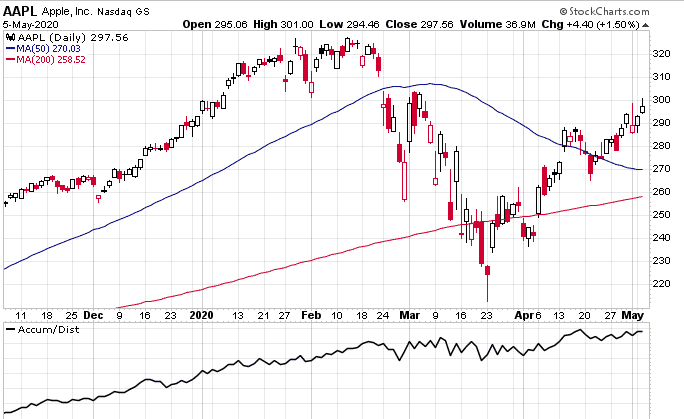
AAPL
Also looks strong. Hit resistance at $300 but there is a lot of accumulation so I wouldn’t be surprised to see this break out again soon.
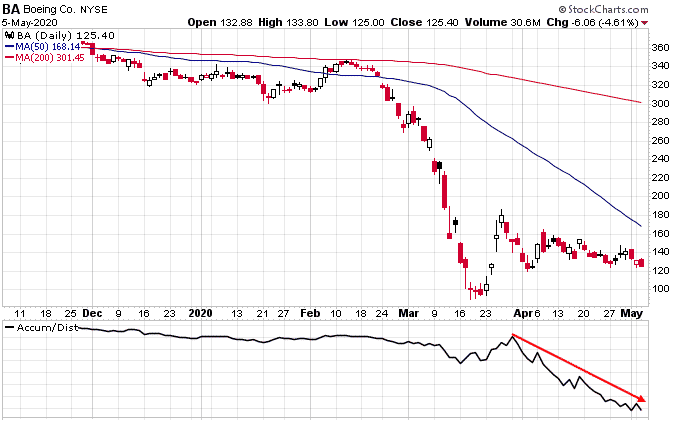
BA
Boeing on the other hand continues to look weak. I think this needs more time to find a bottom and wouldn’t be going long until there is some sign of accumulation.
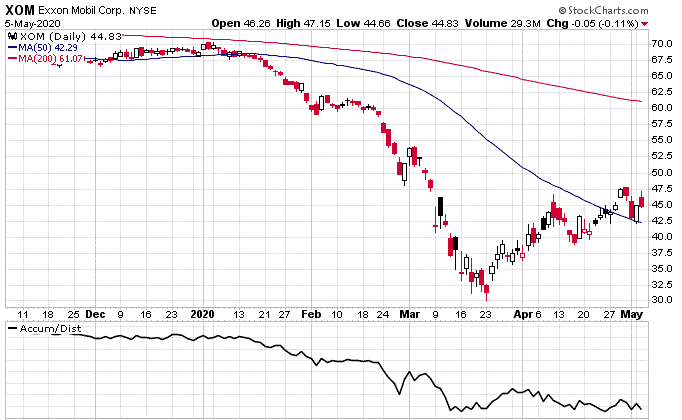
XOM
XOM also looks a bit weak, especially if you compare it to CVX. Really needs to hold above that 50-day moving average.
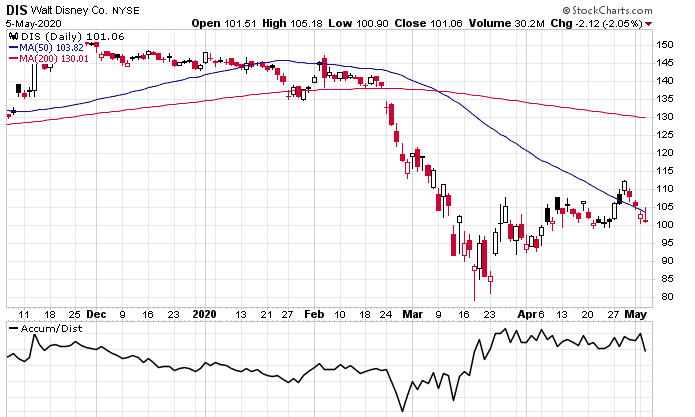
DIS
Reported earnings after the close and is at $98.80 in the after-hours market. Don’t like the fact that it popped above the 50-day moving average then swiftly head back below again. $100 is key support but looks like that might be broken tomorrow, let’s wait and see.
AXP
Another one that dropped back down below the 50-day moving average and is trading within a range between $85 and $95. Should break out at some point, but which way?

If you’ve got any other charts of interest, let me know.
Trade safe!
Disclaimer: The information above is for educational purposes only and should not be treated as investment advice. The strategy presented would not be suitable for investors who are not familiar with exchange traded options. Any readers interested in this strategy should do their own research and seek advice from a licensed financial adviser.


