


Contents
Key Terms
Let’s start by defining terms.
The Federal Reserve is the central bank of the United States.
Created by the Federal Reserve Act of 1913, its official mandate is to create an environment where there is both maximum employment and stable prices.
The Fed’s balance sheet is an accounting of its assets, liabilities, and equity and is used to gauge the degree to which it’s been conducting open market operations.
Open market operations are a means of controlling liquidity in different areas of capital markets.
Traditionally this meant that the Fed would buy and sell US Treasuries, but in recent decades its operations have been expanded to include other securities in its System Open Market Account portfolio.
Most recently the Fed, through its Secondary Market Corporate Credit Facility, has expanded its purchasing to include asset-backed securities (particularly bond ETFs like $JNK and $HYG) traded on the secondary market.
All of these activities increase (or decrease) the size of the Fed’s balance sheet.
So, What’s the Number?
Once a week the Fed publishes a report about its balance sheet.
As of Wednesday, April 22, 2020 the Fed shows $6.5T in assets.
This is up sharply in recent weeks as one can see in the chart.
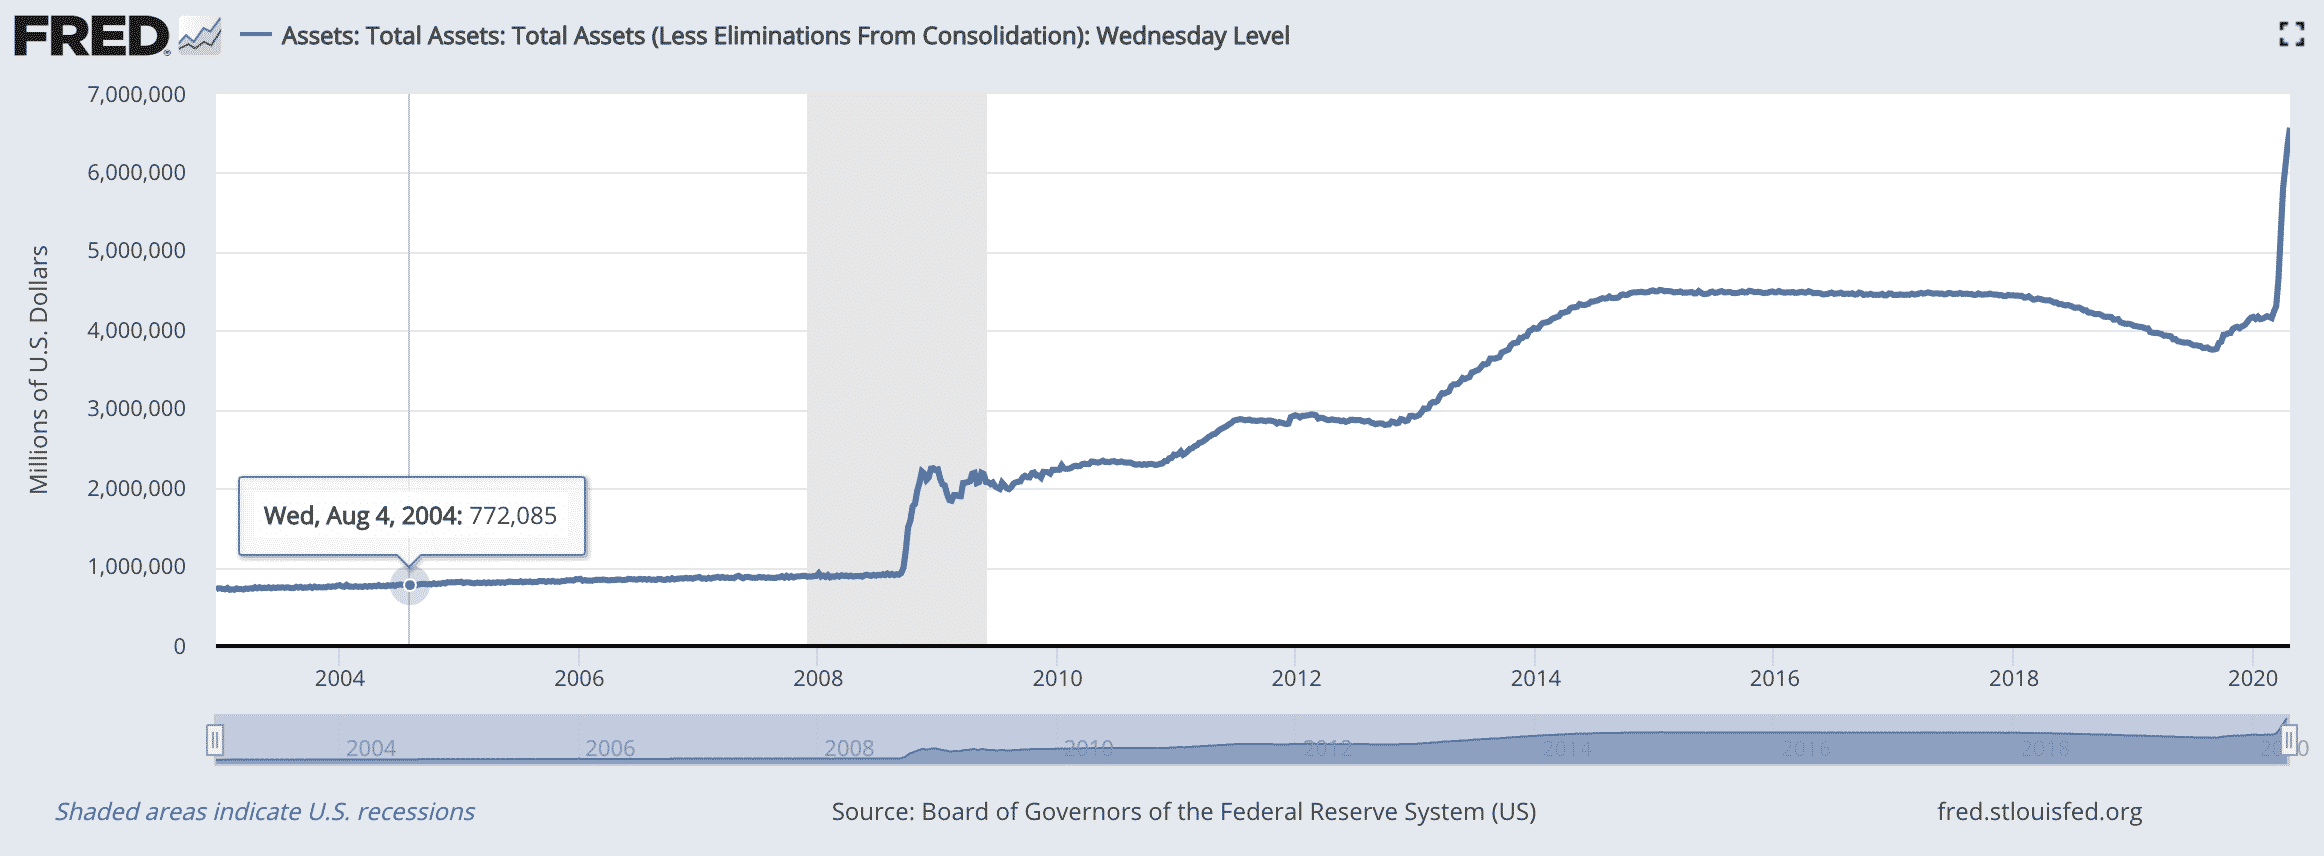
Though this number doesn’t paint a clear picture because the feature that determines whether or not the purchase appears as an asset for the Fed is the intended duration of the purchase.
A good example of this is the recent CARES stimulus package.
The US taxpayer via the US Treasury is pledging $454B in loss-absorbing capital.
The Fed then levered that capital 10-1 and tasked the Federal Reserve Bank of NY to carry out loan and purchasing operations.
Some portion of that money will be for conducting temporary open market operations and some will be for permanent open market operations.
Only the securities acquired in permanent open market operations will show up on the balance sheet.
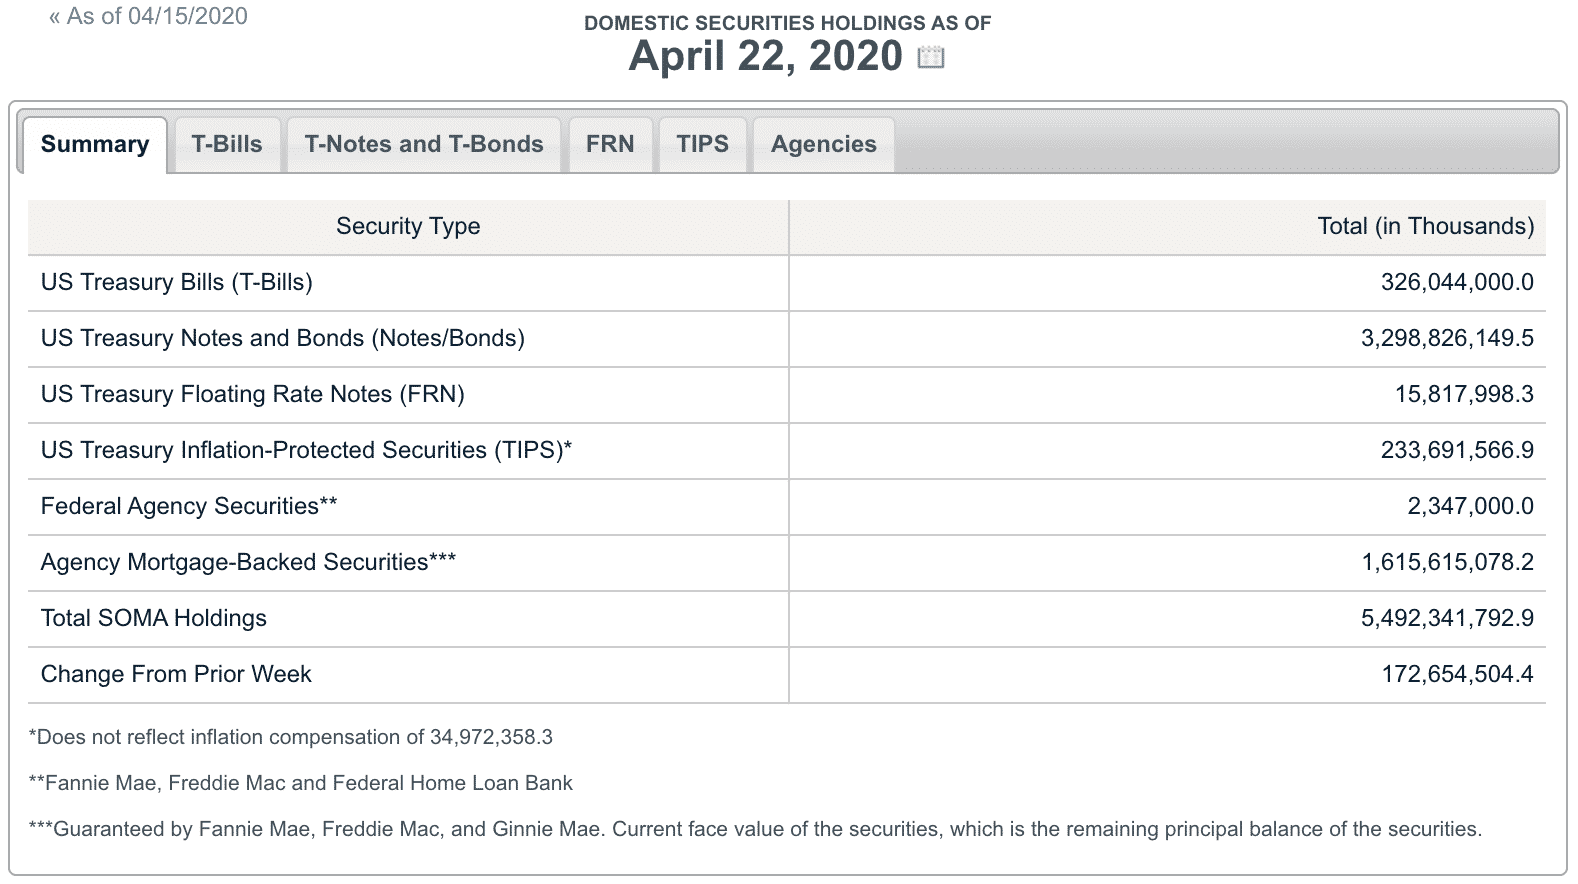
From the NY Fed’s website,
“On March 27, 2020 the New York Fed began purchases of agency commercial mortgage-backed securities (agency CMBS) for the SOMA. Currently, settled agency CMBS holdings are not reported in the below SOMA Domestic Securities Holdings table, Agency MBS Settled Holdings file, or the SOMA Historical Data Export Builder. Please refer to the below Agency CMBS Settled Holdings file for a listing of settled agency CMBS in the SOMA portfolio.”
A quick look at the spreadsheet that they supply for the settled purchases of CMBS shows a sum of $13.7T. The majority of these are from Government
Sponsored Entities (GSE) like Fannie Mae and Freddie Mac.
The data that they report in their table totals $5.5T. The bulk of this is US Treasury Notes and Bonds ($3.3T).
Also notable is that the CARES Act exempts the Fed from government transparency laws that have been in place since the Watergate scandal in 1976.
Going forward, it would be unreasonable to expect more clarification than what we have right now.
Even the global financial services firm PIMCO, who was selected to run the NY Fed’s Commercial Paper Funding Facility and employs former Fed Chairman Ben Bernanke as a Senior Advisor, said this week that they don’t fully understand what the Fed is doing.
The CARES Act passed the US Senate 96-0.
What’s the Impact?
Certainly, the most obvious impact is the stabilization of the financial system and industry.
Since the repeal of Glass-Steagall during the Clinton Administration, there has been unprecedented financialization of the economy.
There’s an atmosphere of risk-taking that simply couldn’t exist if there wasn’t a floor being provided by a central bank.
If the Fed’s mandate was to prevent a collapse of the financial industry, then it’s largely been successful.
The Federal Reserve’s impact on the financial system, banking industry, and asset prices has been obvious and largely successful.
But have regular Americans fared as well?
There are some additional metrics to look at that are related to the Fed’s balance sheet and its open market operations.
It helps provide a clearer picture of what’s happening in the United States.
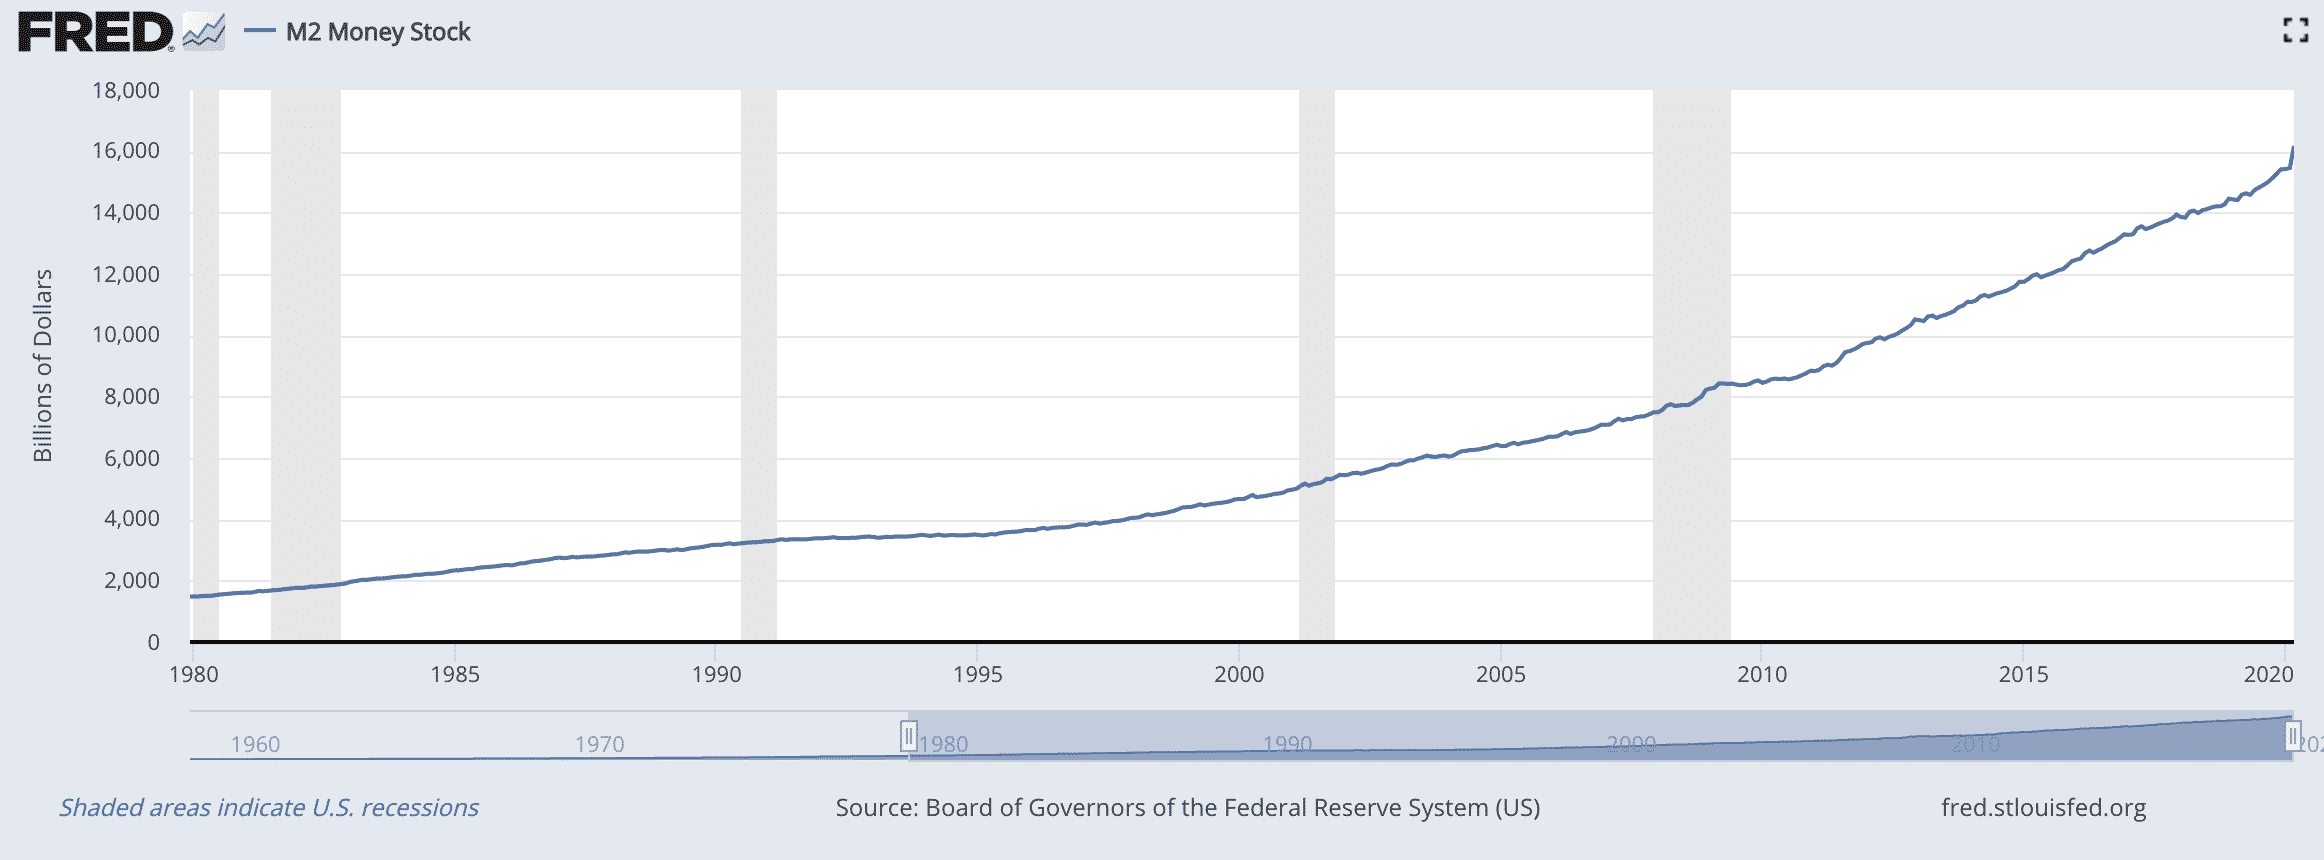
By looking at the chart that shows the Fed’s assets and comparing it to the chart below that shows the M2 Money Supply, it’s easy to see that when the Fed grows its balance sheet, the Supply of Money in the United States increases.
The more liquidity the Fed injects into the system, the more the Money Supply increases.
To be clear, M2 is defined as all liquid currency in circulation plus savings deposits and cash held in Money Market Mutual Funds.
The curve steepens after the 2008 Financial Crisis.
Before that, there appears to be an inflection point around 1995 where concavity switched.
Unfortunately, the Fed doesn’t publish data on assets prior to 2002, so we can’t see what type of purchasing it was doing at that time.
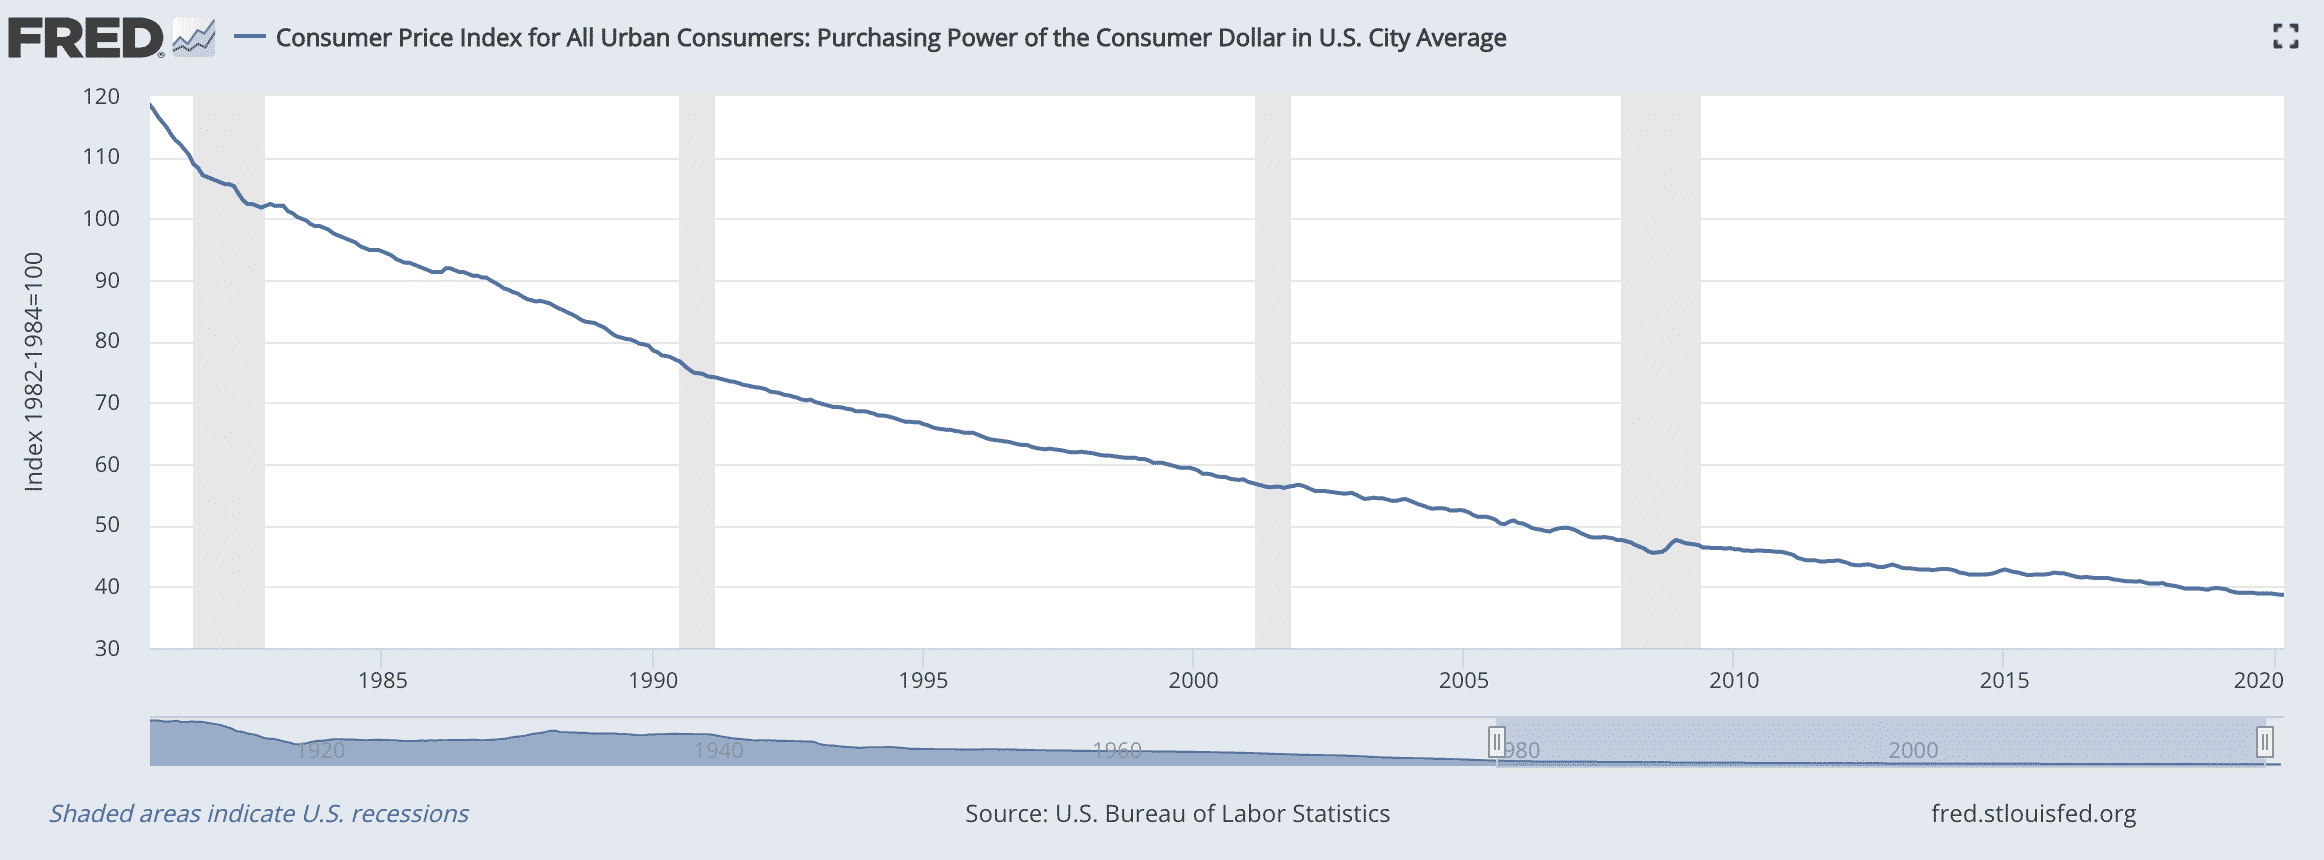
The purchasing power of the consumer dollar simply measures the amount of goods that dollars can purchase.
It follows logically then from these charts that the purchasing power for consumers with dollars is inversely related to the size of the Fed’s balance sheet.
Another factor related to purchasing power that’s worth keeping in mind when looking at this chart is the decoupling from gold which took place in 1971 and was not a policy of the central bank.
A decrease in purchasing power that’s outpacing the increase in incomes, a lackluster labor force participation rate, a top-heavy concentration of financial assets, and a rising GINI coefficient which is currently sporting the same handle as Haiti and Ivory Coast are signals that the Fed might want to consider what exactly its balance sheet means for people on Main Street.
Unwinding
Will the Fed ever be able to reduce its balance sheet?
The Fed began to unwind its purchasing from the Financial Crisis in 2018 which pretty quickly caused a liquidity crisis in the repo market ultimately resulting in the repo rate spiking up to 10% by September of 2019.
The Fed stepped back into this market to purchase Treasury securities as well as mortgage-backed securities.
We can see this moment on the first chart that shows the Fed’s assets.
No examples could be found from other central banks that might show the Fed how to safely unwind.
The Bank of Japan and European Central Bank are in comparable situations and don’t show any sign of backing off their purchases; especially right now.
The BOJ’s balance sheet was already at or above 100% of GDP before the pandemic.
Balance Sheet/GDP will soon grow much larger than what we’ve seen before.
Most central banks have pledged to increase the numerator with unlimited purchasing, and we can expect the denominator to move meaningfully lower.
Richard Fisher, former President and CEO of the Federal Reserve Bank of Dallas said in 2016 that “We injected cocaine and heroin into the system…Now maintaining it with Ritalin.”
Large balance sheets, deficits, and debt is likely to be the new normal as the world puts Modern Monetary Theory to the ultimate test.
Trade safe!
Disclaimer: The information above is for educational purposes only and should not be treated as investment advice. The strategy presented would not be suitable for investors who are not familiar with exchange traded options. Any readers interested in this strategy should do their own research and seek advice from a licensed financial adviser.


