Here are 7 things the charts are saying about the current market. Have a great trading day.
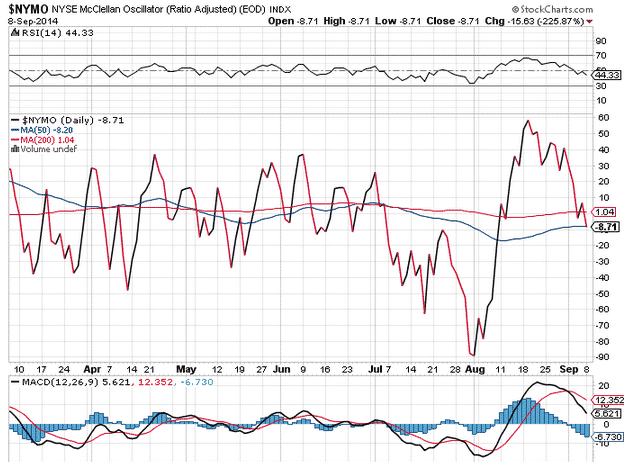
1. The McClellan Osciallator is in neutral territory having come down from the high 50’s.
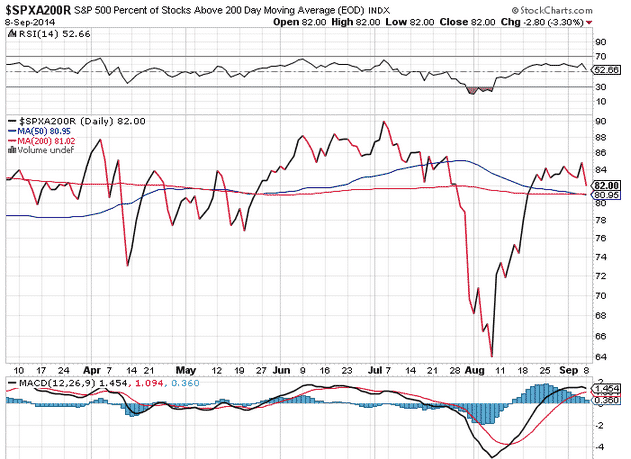
2. The current percentage of S&P 500 stocks above their 200 day moving average is 82%. This is below the high of 90% reached in July.
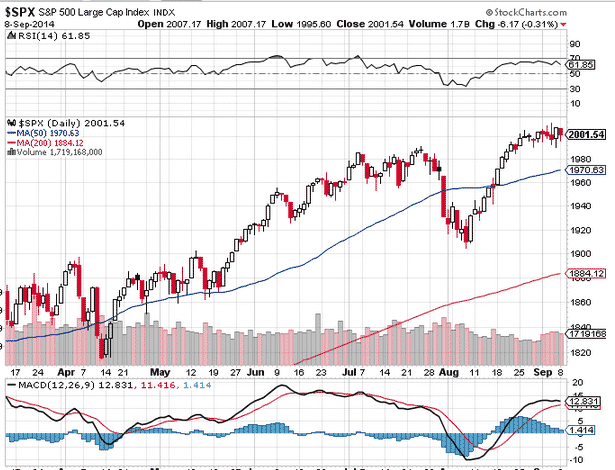
3. The RSI reading for the S&P 500 is 61.85. I would look to sell bear call spreads if that reading reaches 70.
4. The MACD indicator on the S&P500 is getting close to a bearish MACD cross.
5. SPX has traded within a range of 1991 and 2007 since August 2007. That range should break very soon.
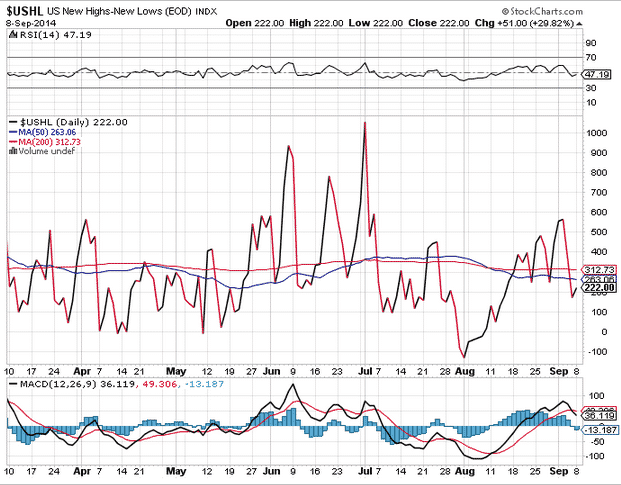
6. The New Highs – New Lows Index is at 222, well below the peaks reached in June and July.
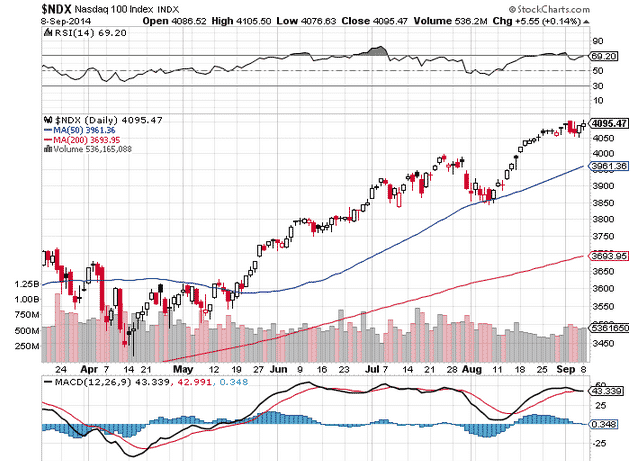
7. NDX has the highest RSI reading of the major indexes at 69.20
1.
2.
3 – 5.
6.
7.