


Here are 5 charts I am currently watching. Have a great trading day.
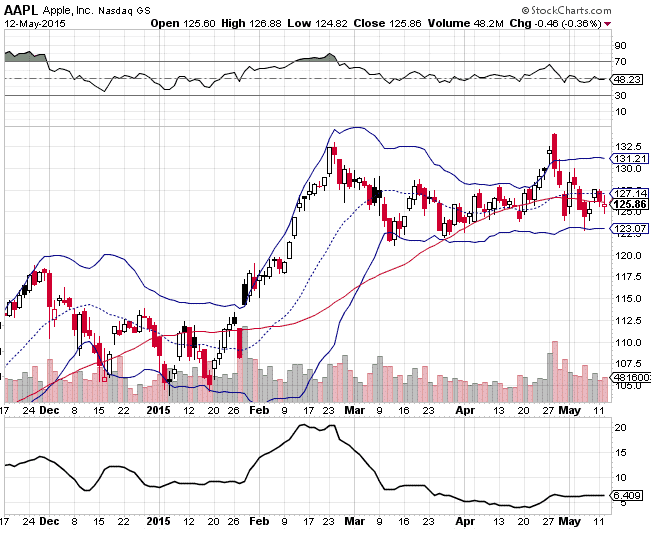
1. AAPL
- Has been more or less range bound for 3 months
- The Bollinger Band Width is near the lowest it has been in the last 6 months
- AAPL is in the middle of the Bollinger Bands
- I’m watching for a breakout either way.
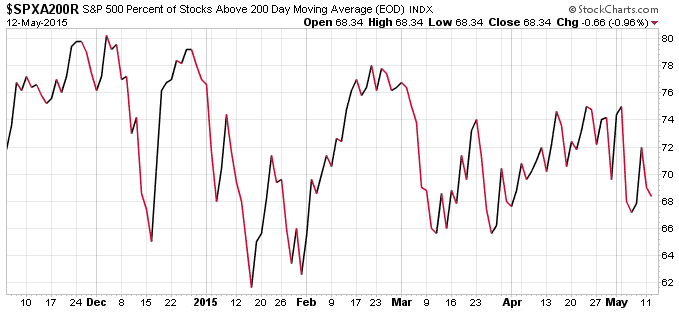
2. SPXA200R
- The percentage of S&P 500 stocks above their 200 Day Moving Average continues to flounder as the major indices struggle at the highs.
- Making successively lower highs
- Currently well below the peak set in December
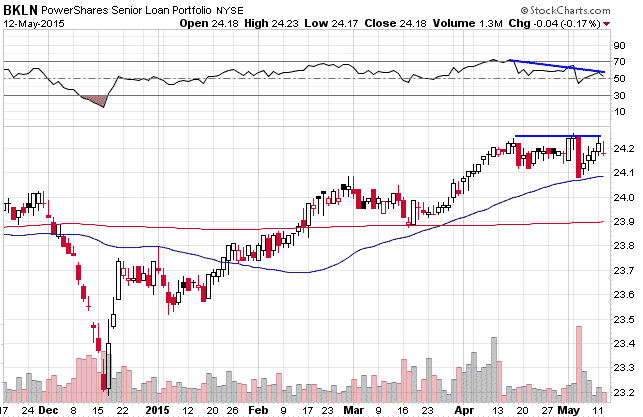
3. BKLN
- Showing RSI divergence at the highs.
- I’m watching this to see if it rolls over or breaks to new highs. Stocks could follow the lead.
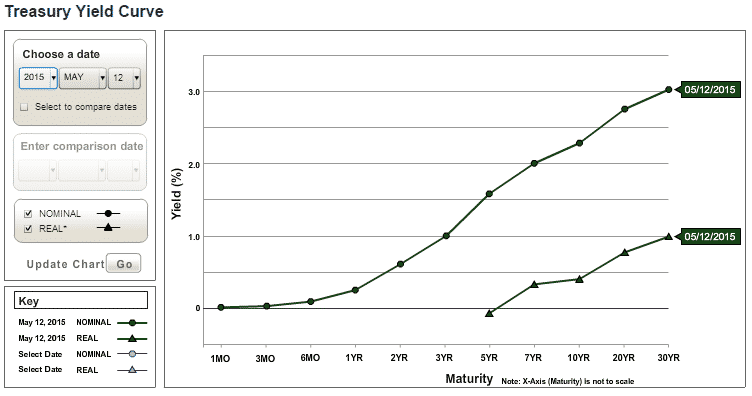
4. Yield Curve
- Negative yield curves are typically seen as a precursor to recession.
- No sign of a negative yield curve here
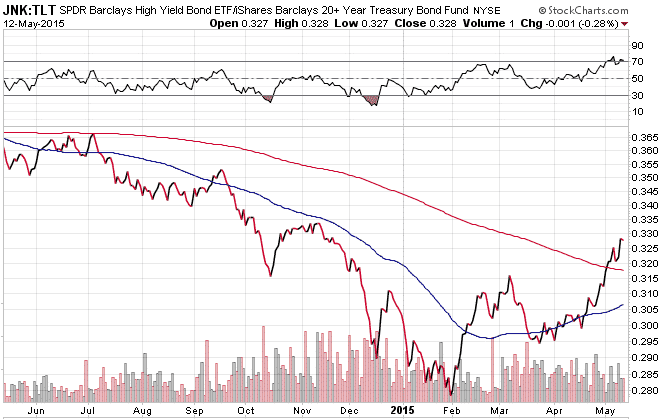
5. Junk Bonds
- Corporate defaults are another item that can cause the economy to falter.
- Right now, junk bonds look pretty strong
Click Here For My Top 5 Technical Indicators


Hi Gavin I would like to thank you for all your very good blog posts. I really learn a lot and could also benefit from some of your teachings. My favorite is selling a short strangle when Bollinger Band Width is at a multi week high. That were some of my biggest winners. Thank you keep up the good work. Andreas (Germany)
Thanks for your comment, always nice to get positive feedback.