

Here are some of the key charts I’m currently watching.
DOW JONES POSITIVE DIVERGENCE
Some positive signs here that we may have a small bounce for the rest of the week. You’ll see similar divergences on most major indexes and ETF’s.

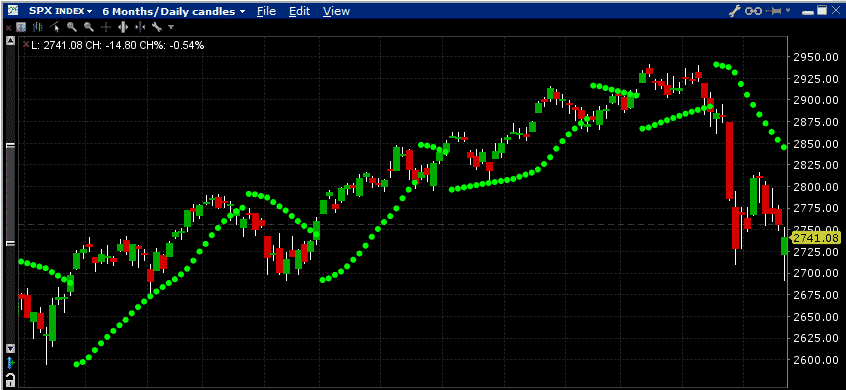
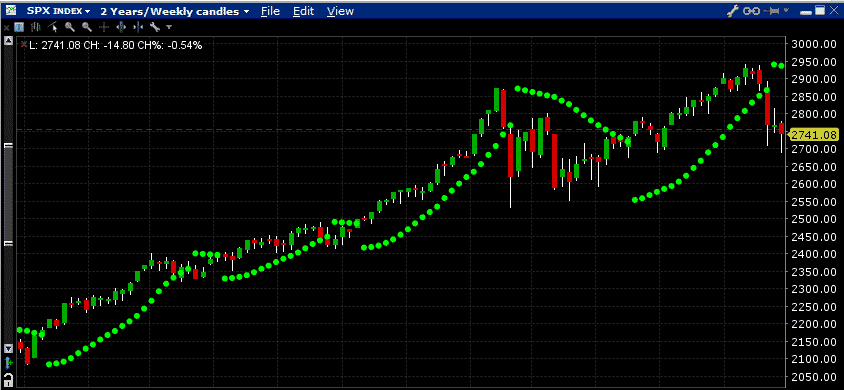
SPX PARABOLIC SAR
This turned positive late yesterday. Need to see some follow through.

But, on the longer term timeframes it’s still on a sell signal.
Click Here For My Top 5 Technical Indicators
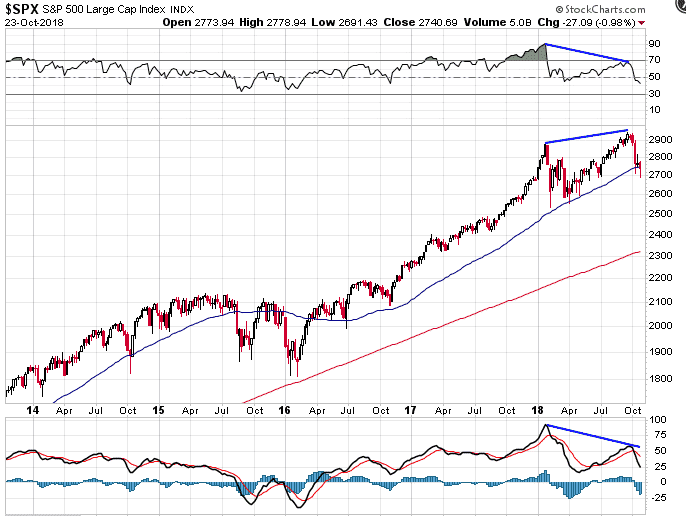
NASTY LONG TERM NEGATIVE DIVERGENCE
This looks really nasty and I think from here rallies need to be sold into.
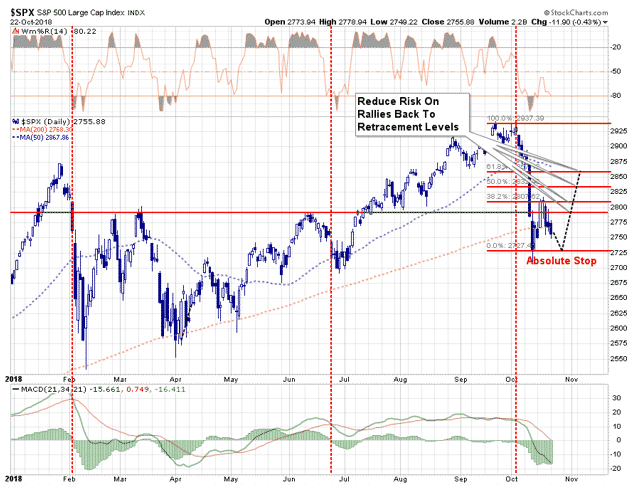
REDUCE RISK ON RALLIES
Here are a couple of other interesting charts from around the web. Firstly from Lance Roberts on Seeking Alpha – “With the markets oversold from recent selling, it is more likely than not we will get a bounce, which will provide a better opportunity to reduce risk into.”
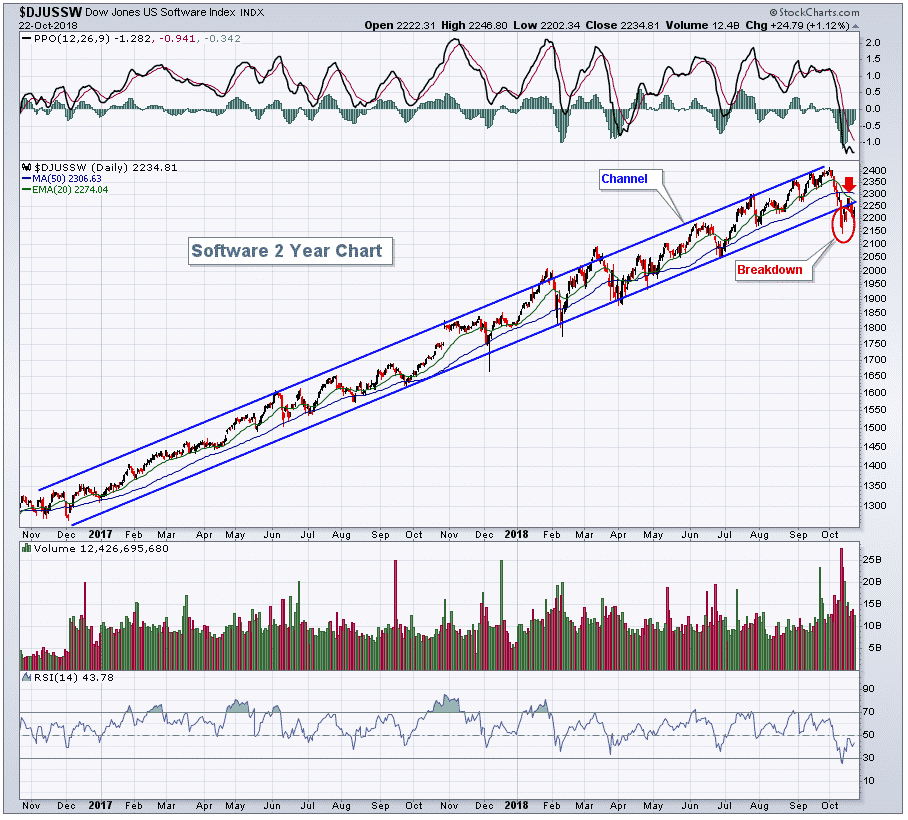
SOFTWARE BREAKDOWN
From Tom Bowley on StockCharts – “Volume accelerated on the recent selling as a multi-year up channel snapped. That is going to lead to further short-term selling, in my opinion. A major bottom in the index is likely to be carved out, but where will the bottom be? I don’t have the answer as support levels during panicked selling don’t seem to matter much. I’d rather sit on the sidelines with my capital intact and let the market determine that bottom for me.”
So to me, seems like we might have a small relief rally this week which should be sold into.
Trade Safe!
Disclaimer: The information above is for educational purposes only and should not be treated as investment advice. The strategy presented would not be suitable for investors who are not familiar with exchange traded options. Any readers interested in this strategy should do their own research and seek advice from a licensed financial adviser.


