


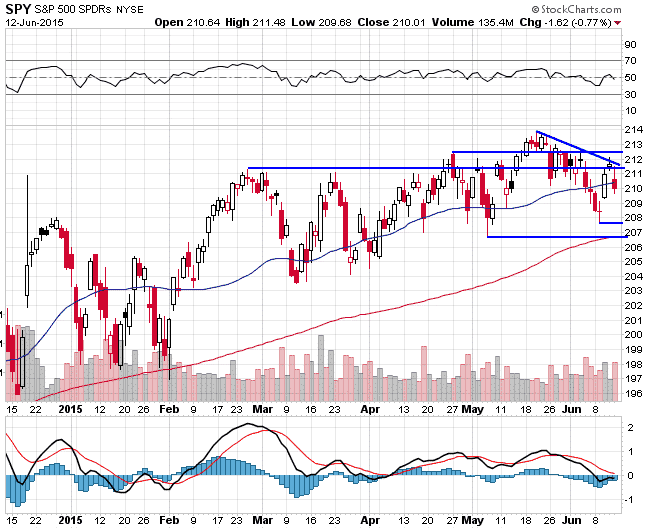
1. SPY is in a first and second timeframe downtrend
2. The most recent trendline is bearish
3. RSI has been neutral since early March
4. Short term resistance comes in at $211.10 and $212.50
5. Short-term support is $207.69 and $206.76
6. The 150 SMA has provided support in the past
7. The 150 SMA currently sits around $207
8. SPY has not retraced to the 150 SMA since early Feb
9. SPY is below the 50 SMA
10. MACD is negative


