


At the end of each year, it’s always interesting to take a look at some of the best and worst performing industries and sectors for the previous year. By the end of 2016, renewable energy stocks had been absolutely smoked for nearly two years.
The rest as they say, is history. $TAN has gone from $16 to $25 in 2017 and $FSLR went from $32 to over $60!
Despite this being one of the most amazing bull runs in history, with historic lows in volatility and not a single negative month on the S&P 500, small pockets of this market have really struggled.
Retail has been particularly hard hit this year thanks to the never ending Amazon juggernaut, however it does not even make the top 10 worst performing industries according to FINVIZ.
Below you will find the top 10 worst performing industry segments for 2017.
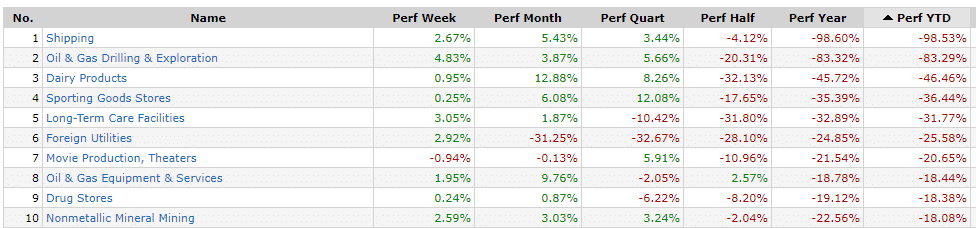
I took a quick look through these to find some individual stocks of note and three jumped out at me.
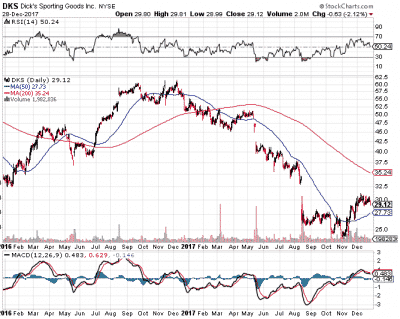
Dicks Sporting Good – DKS
It’s been a tough year for DKS with the stock down 45% for the year. Looking purely at the technicals, the stock appears to be trying to base and is holding above the 50 day moving average. The 50 day is rising, so if the stock can stay above that level, who knows, maybe it could test the 200 day moving average in 2018.
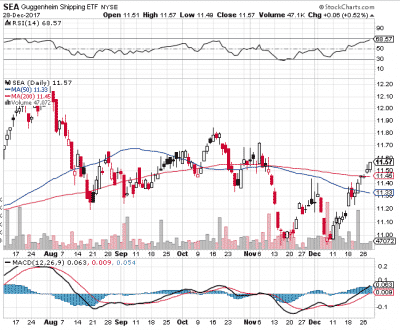
Guggenheim Shipping ETF – SEA
The Guggenheim Shipping ETF is only down around 1% for the year, but there a couple of really constructive items on the chart below. Firstly the ETF has reclaimed both the 50 and 200 day moving averages. Secondly, it has put in a successful double bottom pattern which could see the ETF test $11.80 very quickly.
Dean Foods, Inc. – DF
This dairy products manufacturer has had a rough year with the stock down 46%. However, like DKS, the stock appears to be trying to put in a base. The stock has broken above the 50 day moving average and that average is now rising. Could we see a test of the 200 day in early 2018?

Trade safe!
Disclaimer: The information above is for educational purposes only and should not be treated as investment advice. The strategy presented would not be suitable for investors who are not familiar with exchange traded options. Any readers interested in this strategy should do their own research and seek advice from a licensed financial adviser.


