
The VIX today closed at 11.11, a very low value compared to levels seen in past years, but well off the lows so far this year.
So why is the VIX so low in 2017?
So far this year, the VIX has closed below 10 more times than any other year in recorded history.
Download the Implied Volatility Calculator
A lot of market strategists are seeing the low VIX as a warning sign for stocks. However, other strategies argue that these low vix conditions could persist for some time.
There is a lot of research out there that suggest low volatility begets more low volatility and high volatility begets high volatility. So the low VIX in 2017 could be here to stay.
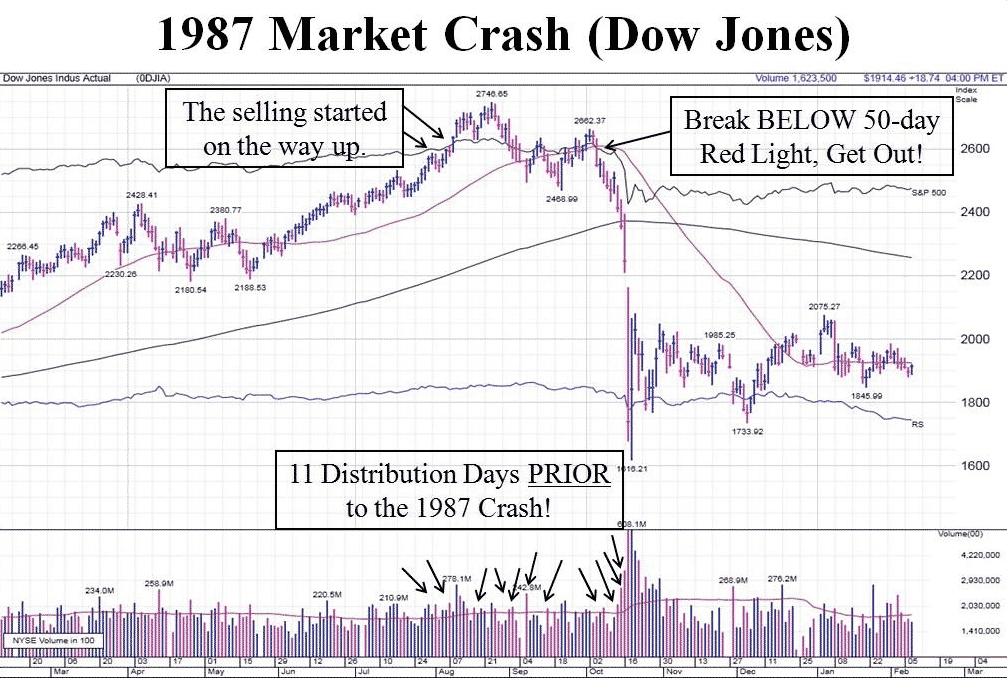
Market tops generally take quite a while to form and we don’t normally see all-time highs one day and then a market crash the next.
You can see in the chart below of the 1987 crash, there was plenty of warning for investors to start exiting positions.

In the video below, Brian Kelly and Dennis Davitt discuss the VIX and the markets next move.
I hear a lot of traders these days getting into volatility products like XIV, SVXY and UVXY and honestly it scares me a bit. When retail traders start getting into products they don’t understand, it’s a recipe for disaster.
Yes, XIV has gone up loads in the past year. But how many people know that if the VIX jumps from 10 to 20 in one day, XIV goes to zero.
The short vol trade has worked very, very well in 2017, but when it unwinds as everything eventually does, things could get messy.
Trade safe!
Disclaimer: The information above is for educational purposes only and should not be treated as investment advice. The strategy presented would not be suitable for investors who are not familiar with exchange traded options. Any readers interested in this strategy should do their own research and seek advice from a licensed financial adviser.


