


Beta is an important metric for traders to be aware of. This article will help set an understanding of using options beta to trade options.
The measure of Beta is extremely important as in one way or another an investor will be confronted with beta in their portfolio.
This article will help set an understanding of what beta is and give an example of how it can be used to trade options.
Contents
- What is Beta?
- Measuring Beta
- Can we Predict Returns Using Beta?
- Beta and Options
- Using Options Beta as a Signal
- How Can I Use This Beta Number?
- Understanding Why
- Concluding Remarks
There are many metrics that are around to help investors understand risk and volatility. One of the most common is Beta.
What is Beta?
Stocks have both idiosyncratic risk (specific to themselves as a company) and systematic risk (specific to the market).
Let’s take the example of an investor that puts all their money in Boeing stock. That investor is taking on the idiosyncratic risk.
Boeing’s airplanes may crash, or an investigation could reveal faulty equipment causing recalls. These are all risks specific to Boeing.
Yet Boeing also has systematic risks. For example the Covid pandemic had nothing to do with Boeing itself but hit the stock especially hard, along with the majority of the market.

Source: Toonpool
It is easy to diversify against idiosyncratic risks.
For example an investor in the S&P 500 would have already diversified away most of their idiosyncratic risk of Boeing’s faulty aircraft.
After all, what does one company matter when you are invested in 500? Yet this index investor still has a lot of risk in their portfolio.
This is the systematic risk, or beta.
Measuring Beta
Beta is the systematic risk of a security or portfolio against that of the market. The market portfolio, usually the S&P 500, is assigned a beta of 1 as a benchmark.
Beta of 1: Stock moves equally with the market (example: SPY up 1%, FB up 1%)
Greater than 0 but less than 1: Stock moves with the market but less than the market (example SPY up 1%, MCD up 0.5%)
Beta of greater than 1: Stock moves more than the market (example SPY up 1%, AMD up 3%)
Can we Predict Returns Using Beta?
Based on our beta we can predict that during bull markets high beta stocks will outperform low beta stocks and during bear markets those same high beta stocks will underperform.
This is a reasonable predictor but not perfect due to the inherent issues with beta.
Firstly beta is backward looking, this is limiting as companies, economic regimes and crises change.
Beta also makes the assumption that volatility is the same in both directions. As an astute investor these limitations should not be overlooked.
Despite this, shortcomings are often present in any calculation or formula.
As we will see later in our example there is both usefulness and limitations to beta.
Beta and Options
As an options trader, beta is an especially useful metric.
This is because we are making trades based on how much we think the stock will move, or its implied volatility.
By comparing the implied volatility to the beta we can help determine whether that volatility is low or high.
Using Options Beta as a Signal
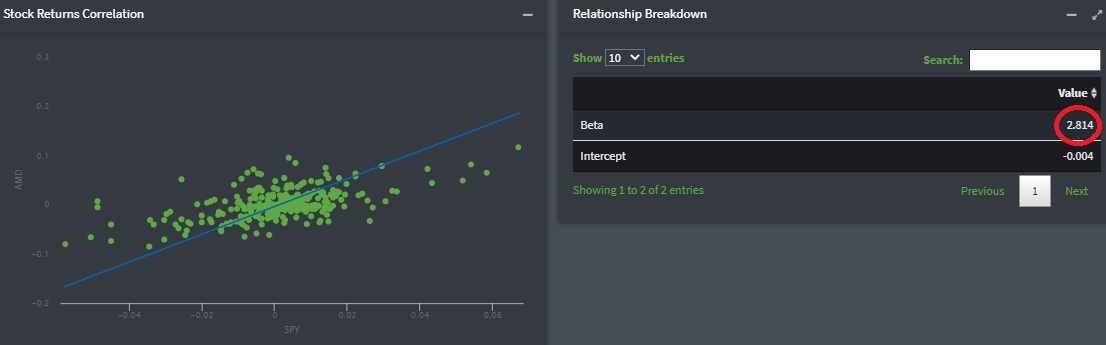
Let’s say we are wanting to trade options on AMD (a major semiconductor company). Below I have plotted the returns of AMD against the S&P 500.
Source: Predicting Alpha
Here we can see that AMD has a beta of 2.8. Meaning that for every 1% move in the S&P 500 AMD would on average move 2.8%.
The first thing to note is this beta is simply a best fit line.
We cannot guarantee AMD will move up 2.8% if the S&P 500 goes up 1%. It might even go down! Nevertheless it works as a reasonable estimation of returns.
How Can I Use This Beta Number?
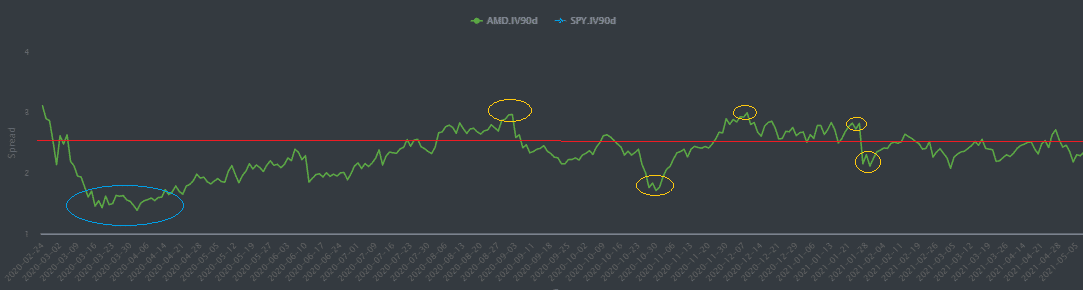
Below I have plotted the 90 day implied volatilities of AMD divided by the S&P 500. We can see that the ratio fluctuates but is always above one.
Naturally AMD is going to imply more volatility and usually move more than the S&P 500. After all, it is a semiconductor company against 500 stocks.
I have also drawn our beta line of 2.8 in red.
Source: Predicting Alpha
What do we notice? Well we can see that for the most part the volatilities tend to move back and forth around AMD’s beta of the red line.
The yellow circles could represent times where the ratio was near its extremes.
Yellow circles above the line could be times where AMD’s volatility is expensive relative to the S&P and below the line where AMD’s volatility is cheap.
We can see that each of these times the volatility has then mean reverted back making for profitable trades.
So, what on earth is going on at the blue circle!! This is an example of the relationship between beta and implied volatility breaking down.
It is also exactly during the COVID pandemic. Why would this happen?
Throughout the COVID pandemic certain sectors were hit disproportionately.
Others such as technology and semiconductors (like AMD), which are normally a lot more volatile, became almost defensive plays.
This was thanks to the stay at home and work from home shift. Combine this with an increase in index implied correlation during bear markets (a topic for another article) and it’s not pretty!
Understanding Why
When we have a major divergence of a stock’s beta to that of the index, or another correlated stock, it could indicate a great trading opportunity, though more often than not there is a reason why it’s the case.
Understanding the “why” can help separate a good trader from an average one.
This is just one example of using beta as an options trader.
There are many others. For example, placing the trade in the example above could involve a relative value play where we buy volatility, say a straddle on the undervalued asset while selling a straddle on the overvalued one.
In that case simply buying the same notional amount of volatility on one and selling it on the other would not make sense.
It may be better to beta weight the assets. We know that one asset will likely move more than the other so using beta to size positions is one way to trade them.
Concluding Remarks
Beta offers a good measure of the systematic risk of a stock to that of an index.
As an options trader it also offers a unique measure of volatility that can be used as a comparison to other metrics.
While it is not perfect, as no indicator is, it can be used as a tool in conjunction with others to help evaluate trades and market risk.
Trade safe!
Disclaimer: The information above is for educational purposes only and should not be treated as investment advice. The strategy presented would not be suitable for investors who are not familiar with exchange traded options. Any readers interested in this strategy should do their own research and seek advice from a licensed financial adviser.


Could you please tell me where to find the Beta value and is this Beta 5 years Monthly?
Barchart shows the data under Fundamentals, see below:
https://www.barchart.com/stocks/quotes/nflx