
Just a quick one today to share a couple of charts that caught my eye.
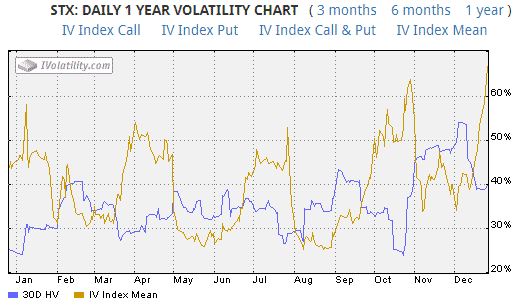
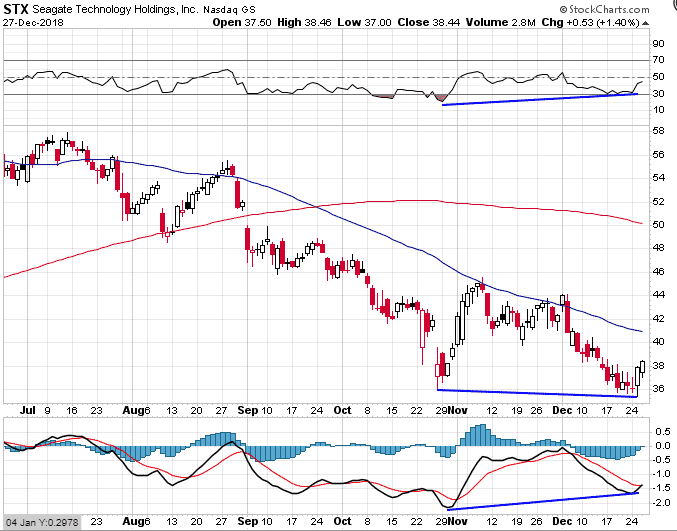
Firstly, STX – Seagate Technology Holdings Inc. caught my eye today, firstly because it had an IV rank of 100 and secondly because of the positive divergence on the chart.
Just look at this, is it not a thing of beauty! Lovely, lovely volatility and nice juicy option premiums.

After looking at a volatility rank like this I always do two things:
Check to see when the next earnings date is set for – all good there as they just had earnings on November 2nd.
Next the chart and I like what I see, to some extent. The positive divergence looks very nice and it seems like the stock wants to come up and test the declining 50 day moving average again.
On the downside, the stock is below the 200 and 50 day moving average and both are declining, that’s generally not a good thing and certainly increases the risks on the long side.

Still, if someone was looking to trade something on the long side, this one could be a good potential, albeit with a nice tight stop loss.
Here’s an example trade:
Date: December 27th, 2018
Current Price: $38.44
Trade Set Up:
Sell 5 STX January 18th, 37.50 puts @ $1.58
Buy 5 STX January 18th, 35.00 puts @ $0.78
Premium: $400 Net Credit.
Max Potential Loss: $850
Here we have a trade with a 47% return potential provided the stock does not decline below $37.50.
The breakeven on the trade is $36.70 and this would be a logical place to set a stop loss. Otherwise if the trade was down around $250 I would look to close it out.
I would also probably look to close early given that rallies in this environment might be short lived.
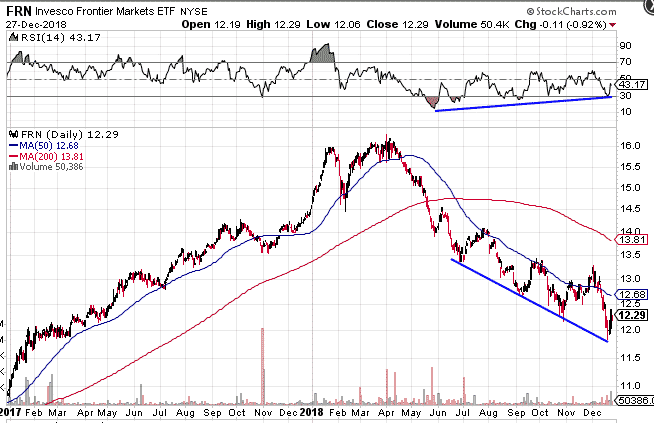
The other chart that caught my eye today was FRN which is the Invesco Frontier Markets ETF.
This one also has some nice positive divergence which is occurring over a long time frame.
Unfortunately, there are no options available on this ETF, but it could be one to watch in 2019 although it is a very risky sector.
I think the drawdown in this one probably has a bit further to play out, particularly if there is weakness generally in global stocks next year.
Ideally, you would want to see FRN recapture the 50 day average and then have the 200 day average flatten out, so despite the positive divergence, there could still be a bit of work to do for this one.

Trade safe!
Disclaimer: The information above is for educational purposes only and should not be treated as investment advice. The strategy presented would not be suitable for investors who are not familiar with exchange traded options. Any readers interested in this strategy should do their own research and seek advice from a licensed financial adviser.


