


Having been involved in the markets for 15 years, sometimes you just see certain patterns repeat time and time again and think, “yep, I’ve seen this before”.
Today was one such case where a couple of key charts gave us a clue that the market might be ready for a nice rally.
Admittedly, the Fed came in and helped things, but I think the market was just looking for a reason to rally. When the market is looking for a reason to decline, good news can be bad news.
I tend to give a lot more weight to technical analysis.
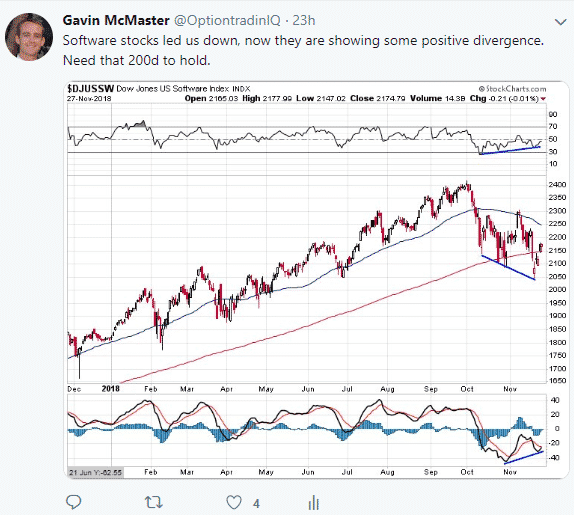
The two main charts that made me think we were due to rally were the Dow Jones US Software Index and the S&P500 hourly chart.
Firstly the software chart. Software was one of the first sectors to break in early October and proceeded to lead the market lower. On the latest decline, there was some MASSIVE positive divergence on the chart, a really good sign, as was the index holding above the 200d moving average. I mentioned as much yesterday on Twitter:
The S&P500 hourly chart also gave us some clues. Here, there was also some nice positive divergence and it was holding above the 20 hour moving average (green line). Last time that happened, the index hit resistance at the 50 hour (blue line). H/t to Tom Bowley for this chart.
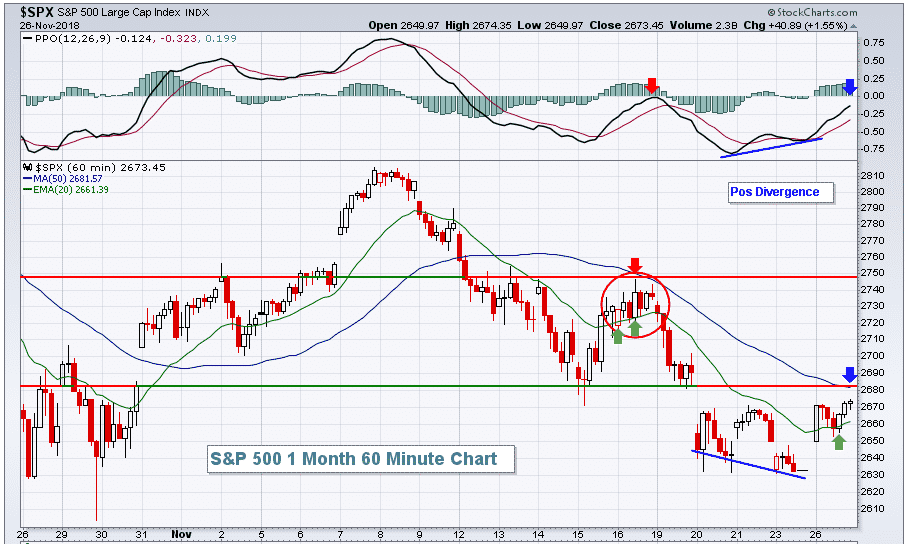
Today, once the index broke above the blue line, it was off to the races.
Click Here For My Top 5 Technical Indicators
Below are 5 more charts of interest.
Dow Jones US Railroads holding nicely above the 200d moving average

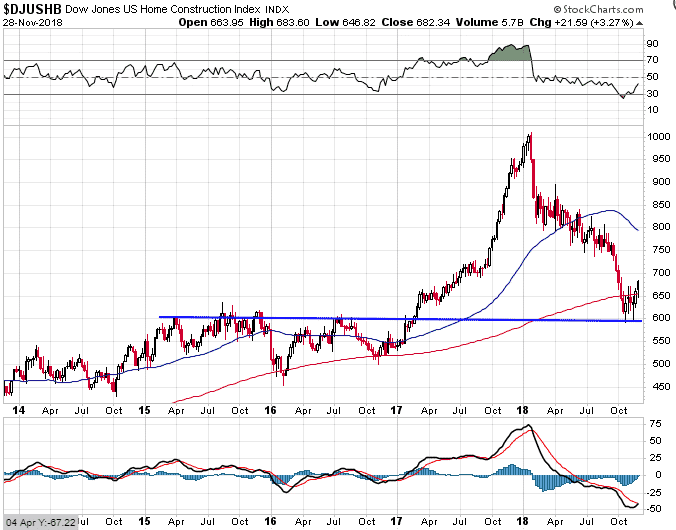
Dow Jones US Homebuilders also was showing some nice divergence
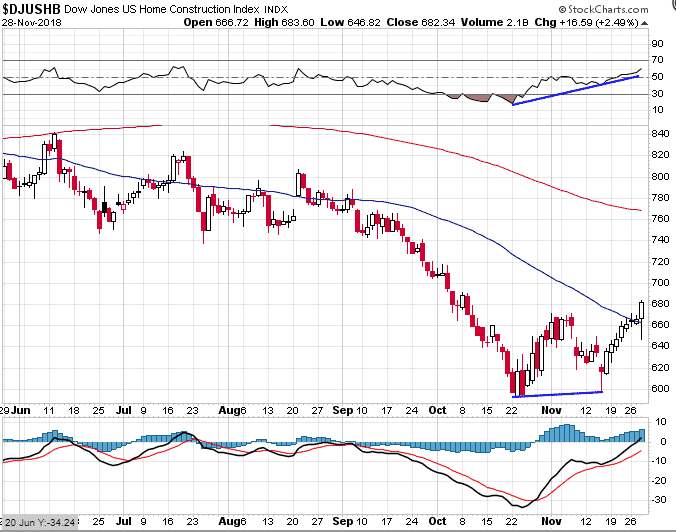
And was holding above a very important support level
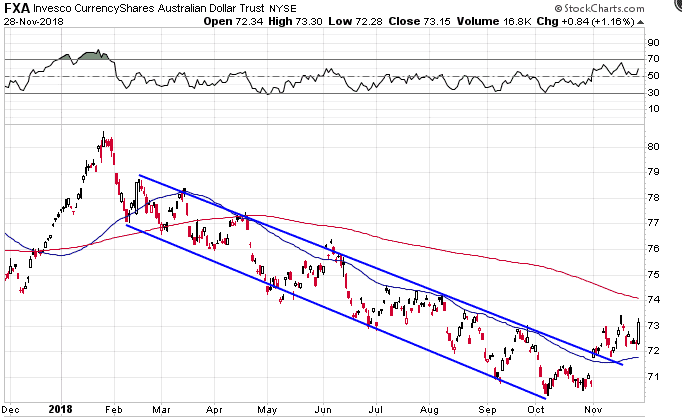
FXA is a really interesting once having been in a long and clearly defined downtrend since February, it has now broken above that channel. Retests have so far held and it is also finding support at the now rising 50d moving average.
The 200d will be the next test, but I feel like there might be some more upside for the aussie dollar.
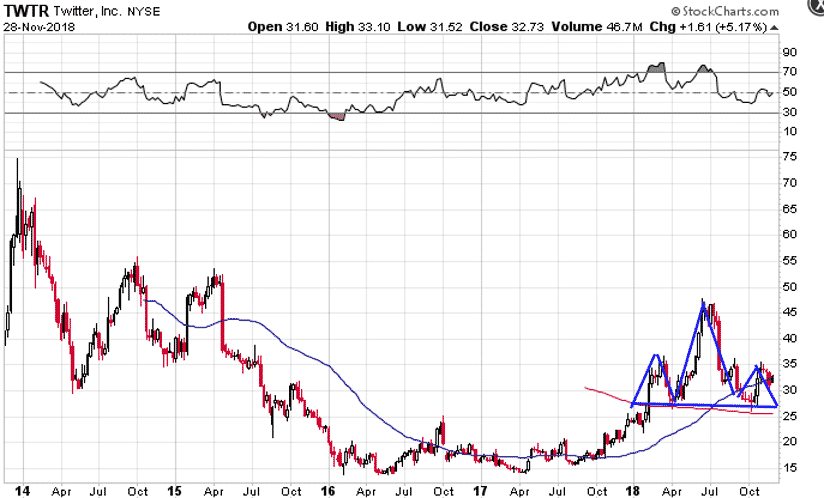
Potentially a large, long-term head and shoulders top forming in TWTR.
Trade safe!
Disclaimer: The information above is for educational purposes only and should not be treated as investment advice. The strategy presented would not be suitable for investors who are not familiar with exchange traded options. Any readers interested in this strategy should do their own research and seek advice from a licensed financial adviser.


