


Before we get to the put option calculator (which can be downloaded below), let’s have a quick discussion about put options generally.
Contents
Put options are a great way for traders to protect a portfolio of stocks or as a way to take short exposure on a stock.
A put option gives the owner the right, but not the obligation, to sell the underlying asset at a specific price through a specific expiration date.
When trading put options, beginners may not understand how profits are calculated.
Today, you will learn that and even get a nice calculator for you that you can download and use for yourself.
What Are Put Options?
A put option is a contract between a buyer and seller.
The contract will be for the right to sell a certain stock at a certain price, up until a certain date (called the expiration date).
Up until the contract expires, the buyer of a call has the right to sell the stock at the agreed price.
On the other hand, the seller of a put option has an obligation to buy the stock if the buyer exercises the option.
If you’re new to options, you may want to check out my 11,000 word beginner guide by clicking the button below.
If you’re a more advanced trader, you will want to check out these articles.
Put Option Premium
For receiving the right to sell the underlying shares, the put option buyer must pay to the seller a premium.
This is the sellers to keep no matter what happens.
When determining the profit for the put option buyer we need to take into account to cost of the premium.
Calculating Profits For Put Options
When calculating the profit on a put option, there are two different scenarios depending on whether you are the buyer or the seller of the option.
PUT OPTION BUYER
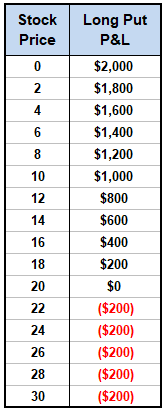
For the buyer, the return on the trade is calculated by taking the strike price minus the ending stock price plus the premium paid.
Let’s say a trader purchased a $22 strike put and paid $2 in premium.
If the stock finished at $16 on the expiration day, the profit would be:
22 – 16 – 2 = $4 per contract
As each contract represents 100 shares, the total profit to the investor would be $400.
The breakeven price on the trade is $20 because we need to subtract the premium paid from the strike price.
Breakeven Price = Strike Price – Premium
Which in this case is:
22 – 2 = 20
If the stock moves higher, the most the trade can lose is the premium paid.
This would occur if the stock finishes above the strike price of $22.
Here is a table to help you visualize the profits and losses at various levels.
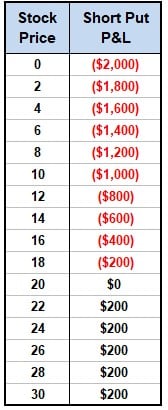
PUT OPTION SELLER
The profit scenario is reversed for the put option seller because the maximum profit they can achieve is equal to the premium received.
The potential losses are unlimited to the point where the stock reaches zero.
The breakeven price for the put seller is also $20.
Anything below that level will see them suffer losses on a one to one basis.
If the stock falls to $14, the put seller would lose $6 per contract or $600 in total.
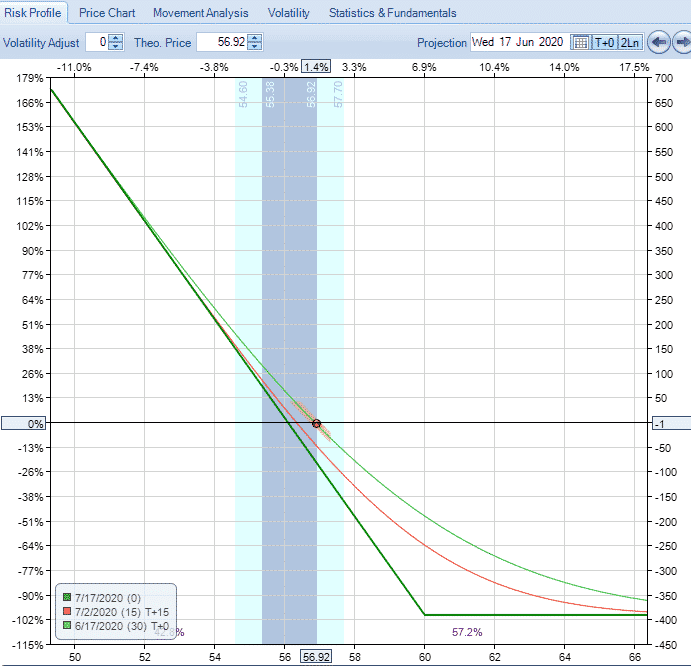
The profit calculation above is at expiration only.
The calculation for interim profits is much more difficult to predict.
This is best done with options software such as Interactive Brokers Risk Navigator or Option Net Explorer.
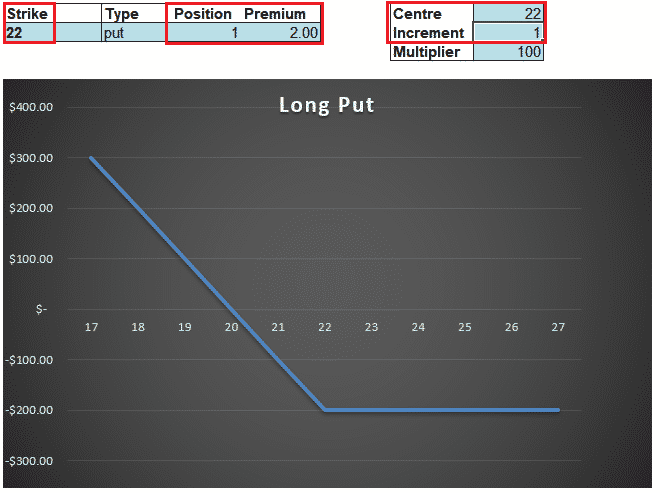
Excel Profit Calculator
These calculations are all quite straight forward, but if you want to visualize this in excel, you can download the handy calculator below.
The bonus is you can also use the calculator for most of the major option strategies.
Step one is to download the file using the button below.
If you’re a put buyer use the Long Put tab and if you’re a put seller use the Short Put tab.
Then simply enter the strike price, the number of contracts (position) and the premium.
Depending on the stock price, you will likely have to adjust the values in Centre and Increment.
Don’t worry about anything else, the calculator will do the rest.
Calculating Interim Profits
As mentioned, this excel sheet will help you visualize the profit at expiry, but if you want to estimate the interim profits it’s best to use some more advanced software.
The below screenshot is from Option Net Explorer and gives you an estimate of the profit at interim dates which you can specify.
Summary
The profits and losses on put options will vary depending on whether you are the buyer or seller of the option.
Put option buyers have limited risk and unlimited gain potential (until the stock reaches zero) whereas the opposite is true for put sellers.
Profits and losses at expiration can be easily calculate using the handy excel tool available for download above.
Calculating the interim profits is more complicated and requires advanced software such as Option Net Explorer.
Trade safe!
Disclaimer: The information above is for educational purposes only and should not be treated as investment advice. The strategy presented would not be suitable for investors who are not familiar with exchange traded options. Any readers interested in this strategy should do their own research and seek advice from a licensed financial adviser.


