


Some stocks and ETFs are highly correlated with each other.
When the price of one goes up, the price of the other also goes up.
Others are inversely correlated with each other.
When the price of one goes up, the price of the other goes down.
How can we determine if two stocks are correlated with each other and by how much?
Contents
Correlation Coefficient
The correlation coefficient will tell us this.
It is a number from -1 to +1.
If the number is positive, it means that the two stocks are correlated with each other.
The larger the number, the more correlated it is.
The two items are not correlated if the number is close to zero.
If the number is negative, it means the two stocks are inversely correlated with each other.
The more negative the number, the greater the amount of inverse correlation.
Example Of Correlation Coefficient
Let’s say we want to compare Coca-Cola (KO) with Pepsi (PEP).
In TradingView, we have opened the daily chart of KO.
Then we add the built-in Correlation Coefficient indicator to the chart:
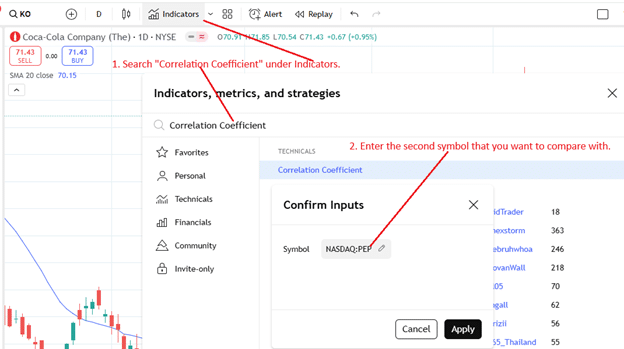
It will prompt you to enter the second stock to compare with.
In our case, we searched and selected PEP for Pepsi.
You will then see the correlation coefficient plotted in the bottom panel underneath the chart:
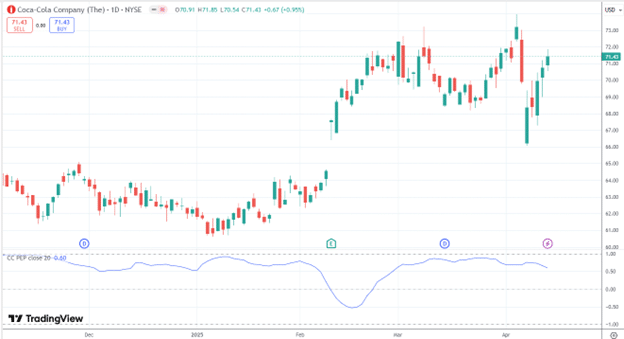
At this moment, the correlation coefficient is 0.60.
We can say that Coca-Cola and Pepsi are 60% positively correlated.
Most of the time, we see the correlation graph as being above 0.50, except that it went inversely correlated in mid-February with a correlation coefficient hitting -0.50.
KO causes this inverse movement between the two stocks, gapped up on earnings mid-February, while PEP gapped down on earnings a week early:
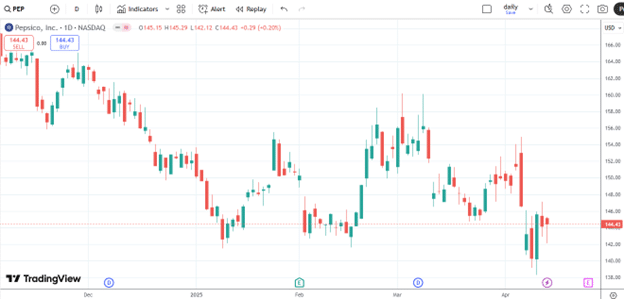
The two stocks moved in opposite directions during that time.
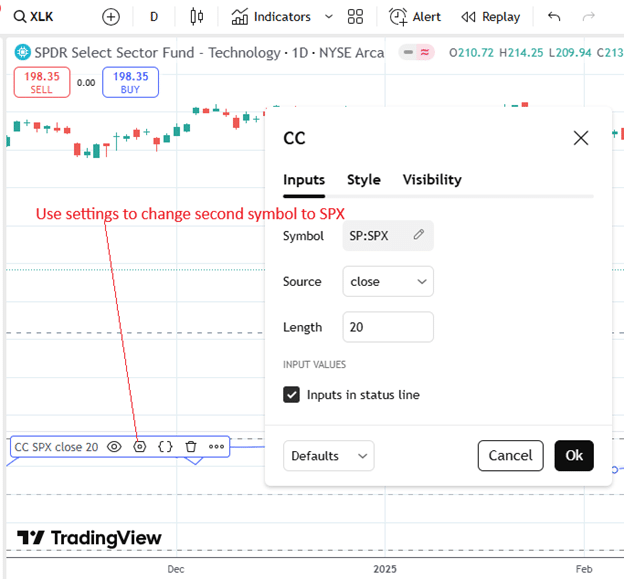
How Closely Does XLK Track The SPX?
The technology sector ETF (XLK) makes up about 30% of the SPX.
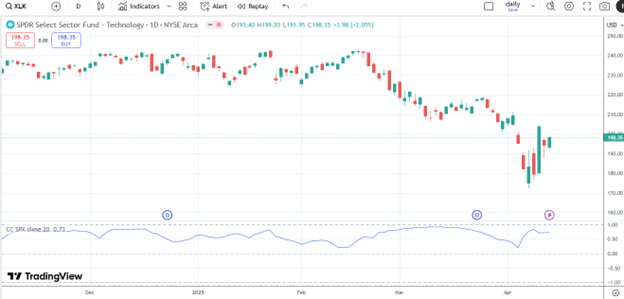
If we look at the correlation coefficient between the two by bringing up the XLK chart and changing the second symbol to SPX…
The graph below shows that XLK is typically more than 50% correlated with SPX.
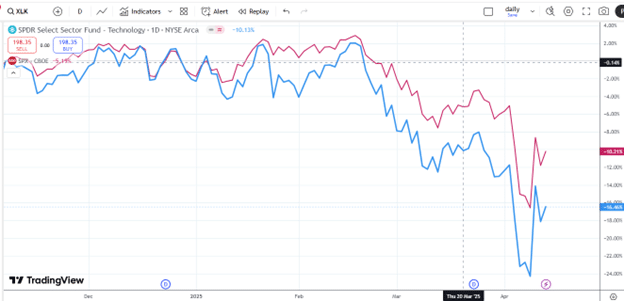
If we were to overlay XLK (blue line below) and SPX (red line) together, we see that they move in tandem…
IBIT Versus GBTC
The two lines would be identical if we overlay the IBIT and GBTC charts.
Without looking at the label and the price axis, you cannot tell if these candlesticks are that of IBIT or GBTC…
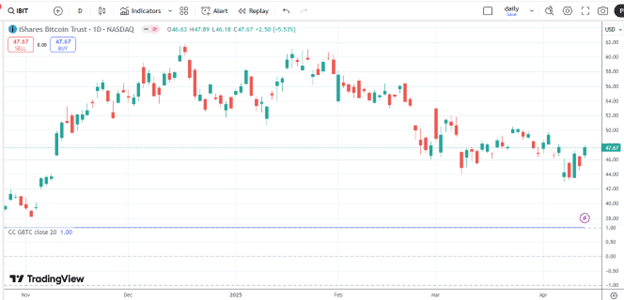
These two symbols have a correlation coefficient of 1.
They are 100% correlated because IBIT and GBTC are both spot Bitcoin ETFs.
BlackRock issues the former, and the latter is by GrayScale.
There will be no difference in the percentage of price movement whether you buy shares of IBIT or shares of GBTC.
If you are trading options, IBIT offers better liquidity based on bid/ask spread and volume.
Inversely Correlated
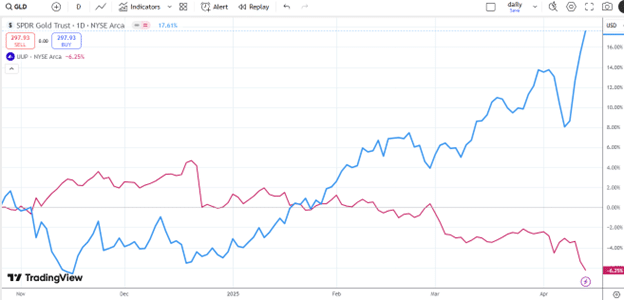
Gold and the US dollar tend to be negatively correlated.
Since gold is a hard asset, it takes more dollars to buy gold as the US dollar weakens.
Here is a chart with GLD (gold ETF) in blue and UUP (Invesco US dollar bullish index fund) in red; we see that they diverge…
Looking at a chart of GLD with its correlation coefficient to UUP in the bottom panel…
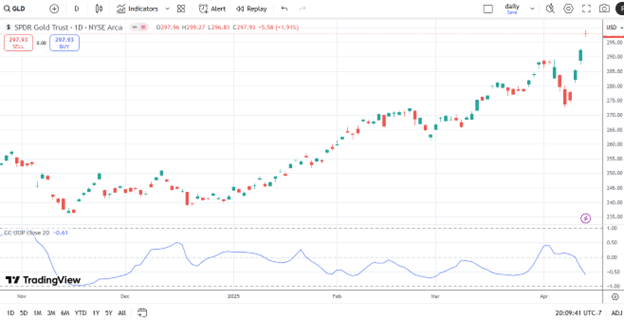
We see that the correlation coefficient is predominantly negative, indicating that GLD and UUP are inversely correlated.
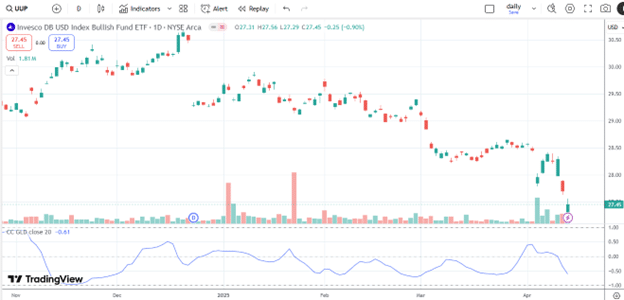
The correlation coefficient graph does not depend on which symbol is first and which symbol is second.
The blue graph in the bottom panel will look the same if we chart UUP with its correlation coefficient to GLD…
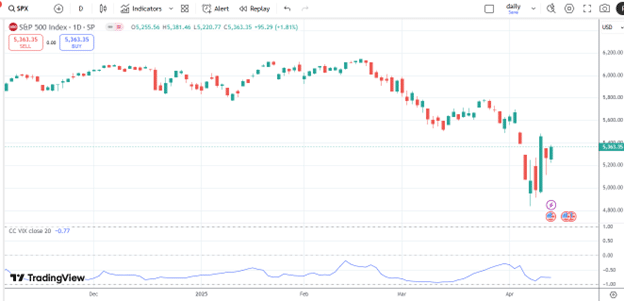
The SPX and VIX
And finally, we know that the market (SPX) and its volatility (VIX) are inversely correlated with each other.
The days when SPX goes down are when VIX usually goes up.
This inverse relationship is evident from their strongly negative correlation coefficient.
Summary
We have given several examples of how assets can be positively or inversely correlated.
You may have an intuitive belief of whether one stock is correlated with another.
Now, you know of an indicator to quantify two stocks’ correlation.
We hope you enjoyed this article on determining the correlation between two stocks.
If you have any questions, send an email or leave a comment below.
Trade safe!
Disclaimer: The information above is for educational purposes only and should not be treated as investment advice. The strategy presented would not be suitable for investors who are not familiar with exchange traded options. Any readers interested in this strategy should do their own research and seek advice from a licensed financial adviser.


