


Today we’re looking at a diagonal put spread example of Boeing (BA). In this example, you will learn why it’s important to stick to your trading rules and cut losses early.
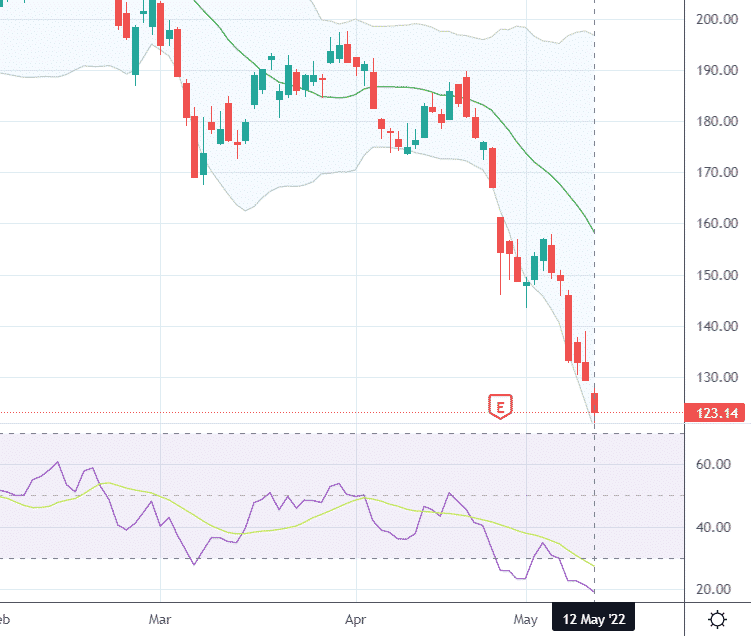
BA gapped down on earnings on April 27th, 2022.
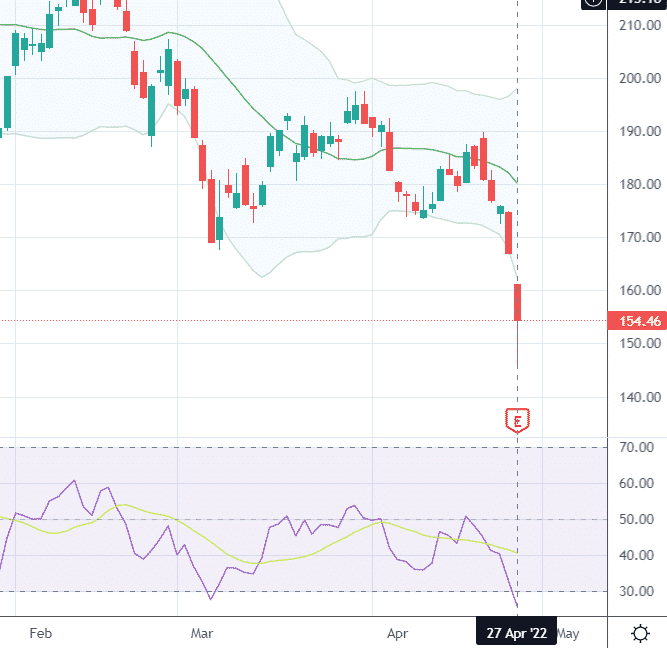
source: tradingview.com
Thinking that it might continue to drift down lower, but not by much, we put on a diagonal put spread.
Date: April 27, 2022
Price: BA @ $154.43
Buy one Jun 17 BA $125 put @ $2.21
Sell one May 20 BA $135 put @ $2.03
Debit: $17.5
Max risk: $1017
As seen from the risk graph below, there is almost no risk on the upside if Boeing rallies back up to fill the gap.
We would lose the debit paid of $17.50 since both put options would then be out of the money.
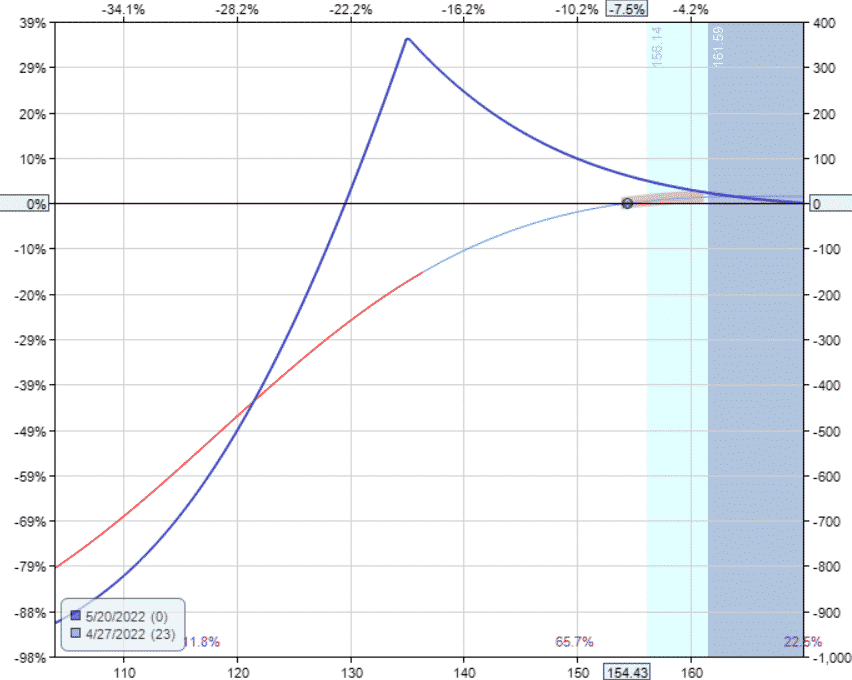
The diagonal would give us profits if the price stays where it is or even drift down slightly lower.
The plan is to exit the trade with profits if we get a 10% or 15% return on risk.
On the downside, we will exit the trade if the price goes below the short strike at $135.
On May 9th, Boeing’s price dropped 10%, with the price near $133 towards the end of the market day.
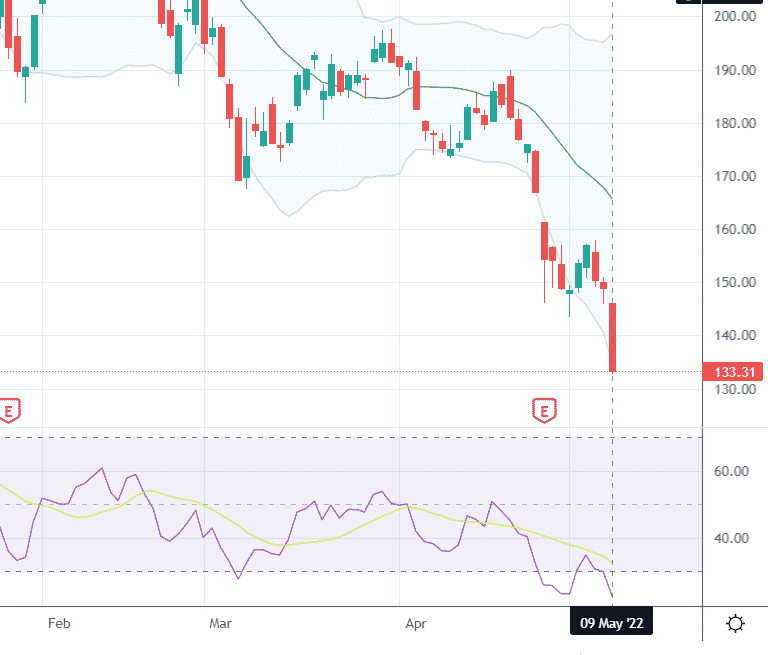
We must obey our rules and close the trade with a loss of –$87, or -8.6% on capital at risk.
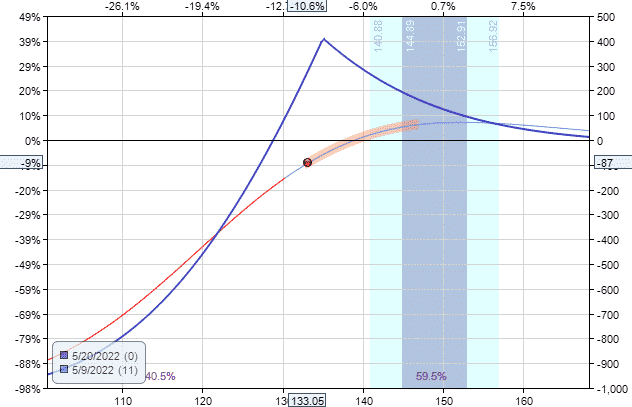
source: OptionNet Explorer
With three red candles in a row and RSI and Bollinger Bands showing oversold condition, there might be a good chance we get a bounce in the next day or two, but rules are rules.
Some traders might be tempted to hold the trade.
The rules are there for the very reason of keeping us out of temptation.
Traders who fell into the temptation and did not exit would have seen three more solid days of selling, with Boeing closing at $123 on May 12th.
The loss on the trade would be –$280, or -27.5%.
Remember that oversold can stay oversold for longer than one might think in a downtrend.
Just because price touches the bottom of the Bollinger Bands does not mean that price will bounce from it.
The band would expand to accommodate the lower prices.
And yes, it is possible to have six red candles in a row.
We hope you learned something from this diagonal put spread example, and if you have any questions, please send us an email or post a comment below.
Trade safe!
Disclaimer: The information above is for educational purposes only and should not be treated as investment advice. The strategy presented would not be suitable for investors who are not familiar with exchange traded options. Any readers interested in this strategy should do their own research and seek advice from a licensed financial adviser.


