


Here are some of the key charts I’m currently watching.
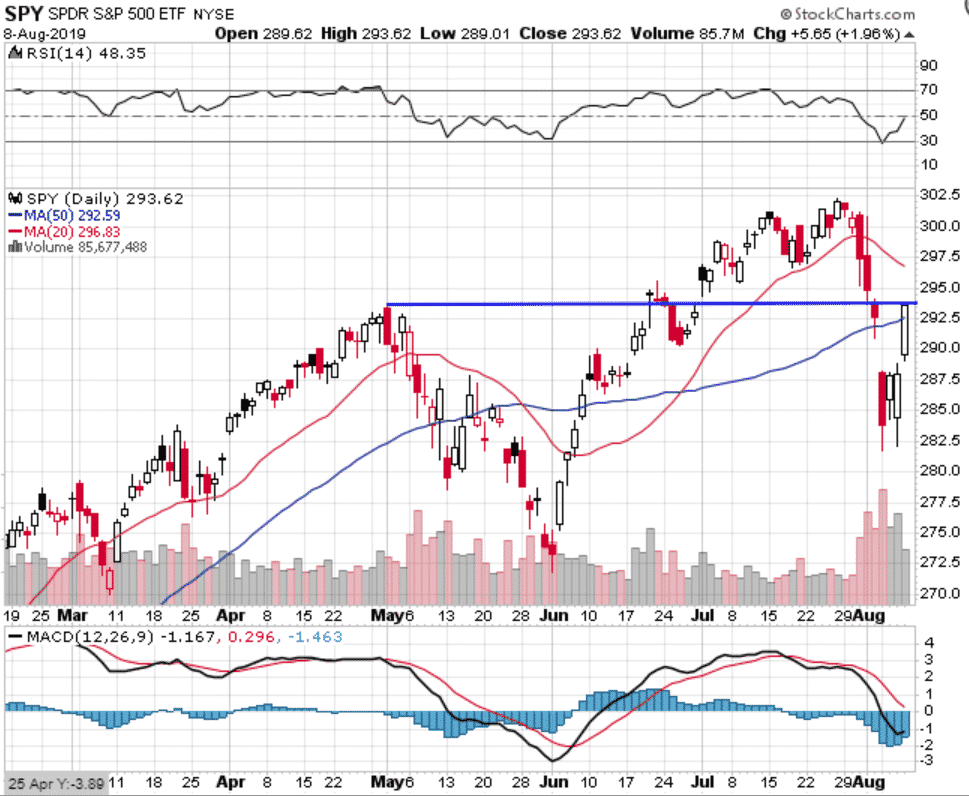
SPY
Nice bounce, but right at key resistance and also the declining 20-day moving average may give the market some trouble. Not necessarily out of the woods yet.
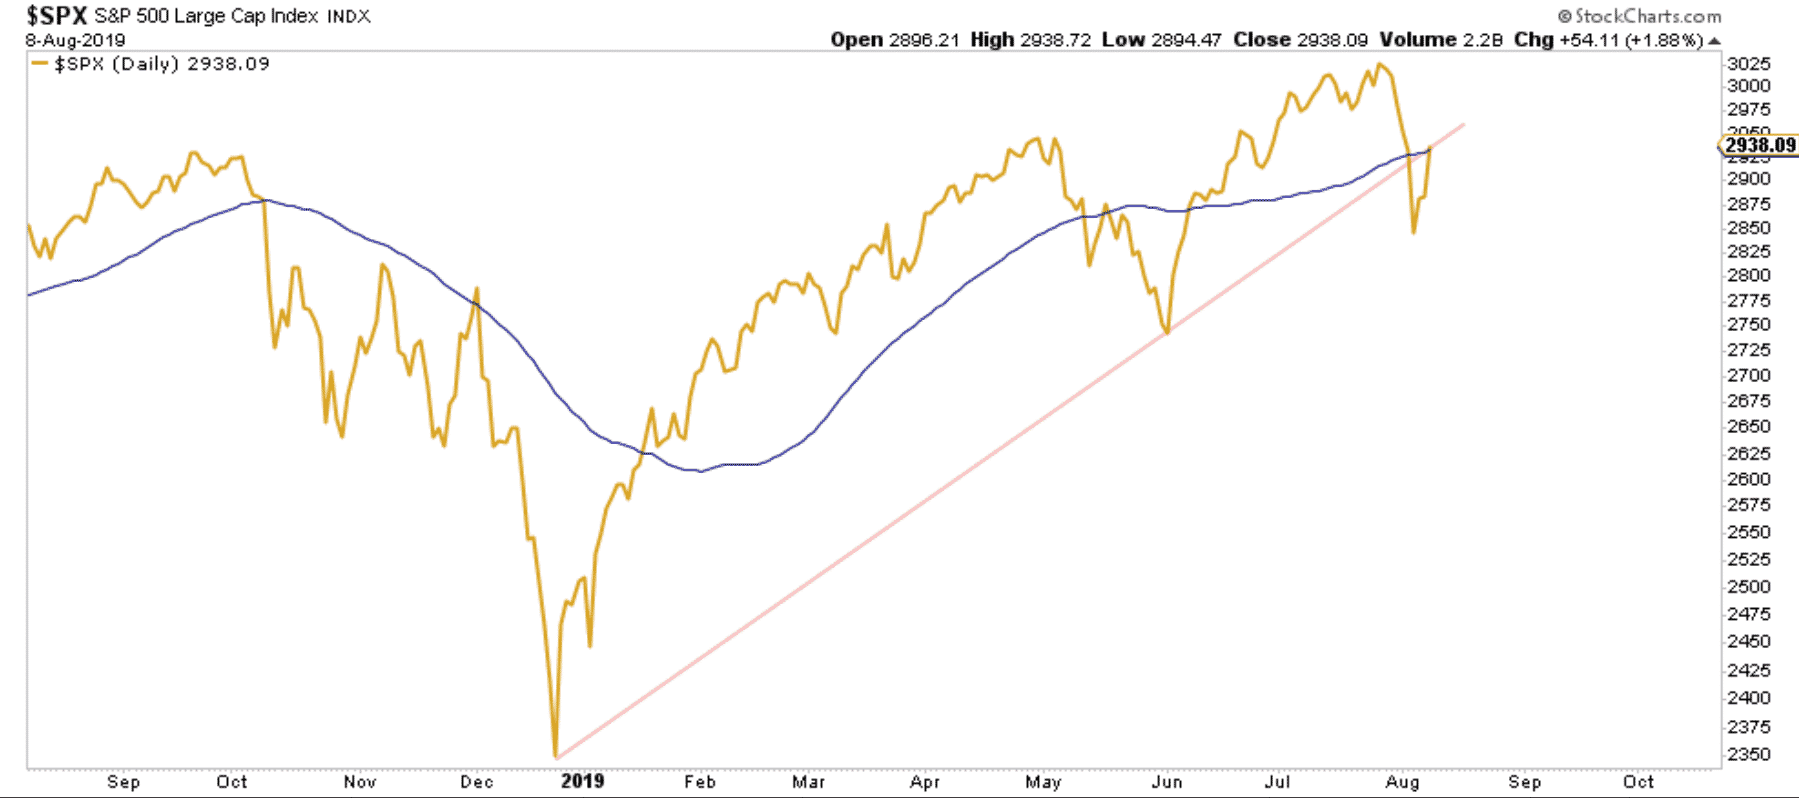
SPX TRENDLINE
Hitting the trendline from below
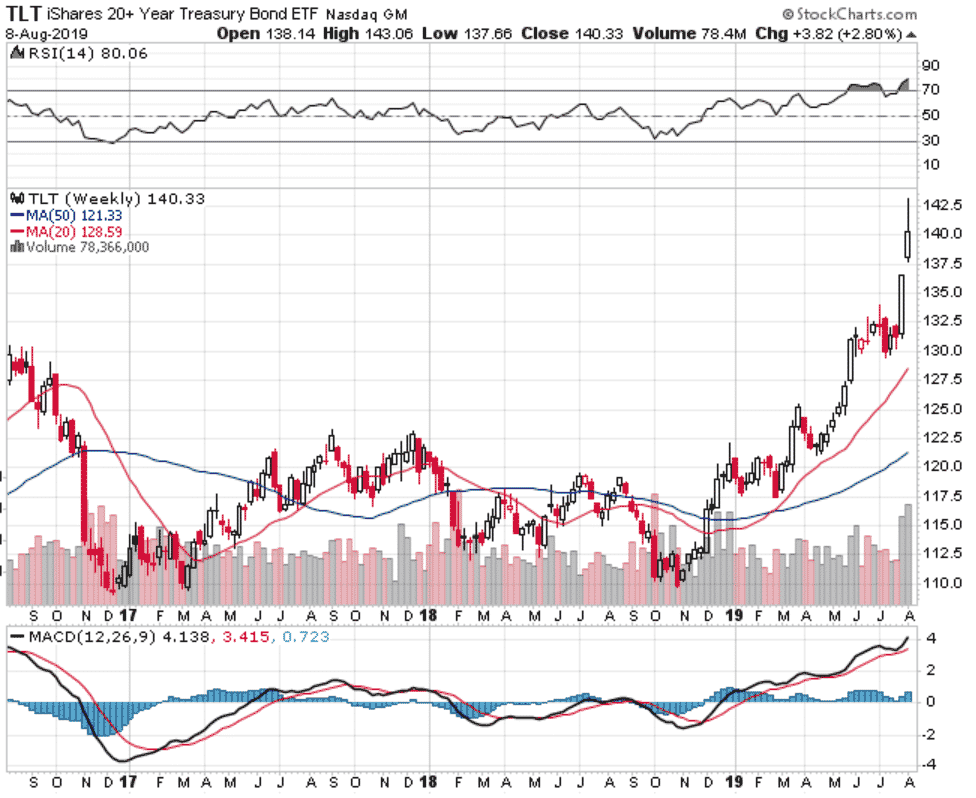
BONDS
Extreme move in bonds. Don’t see TLT going much higher from here.
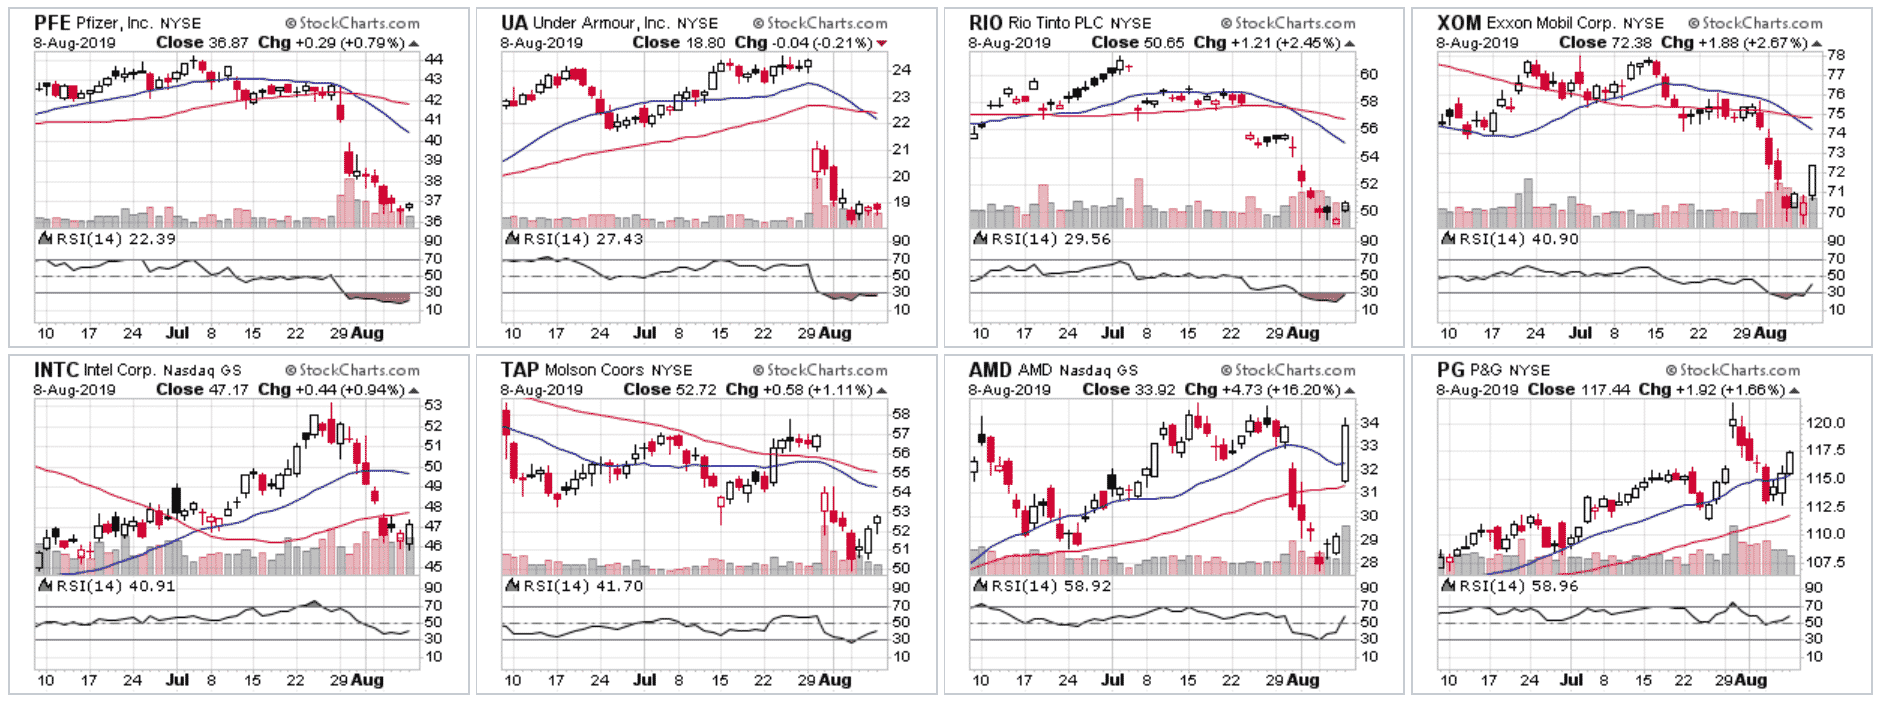
OVERSOLD STOCKS
Some oversold stocks on my radar.
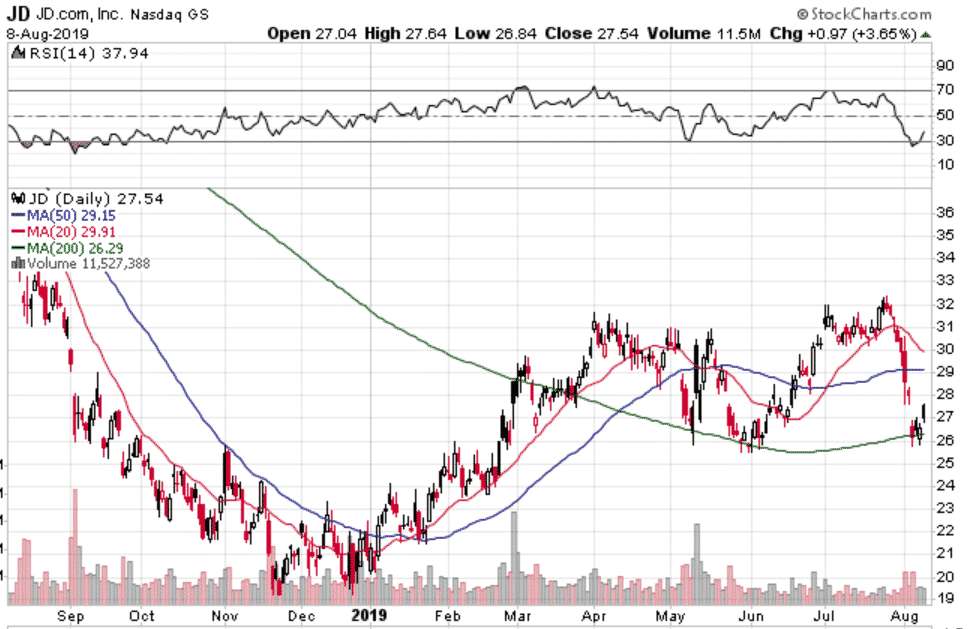
JD
Nice hold of the now rising 200 day moving average.
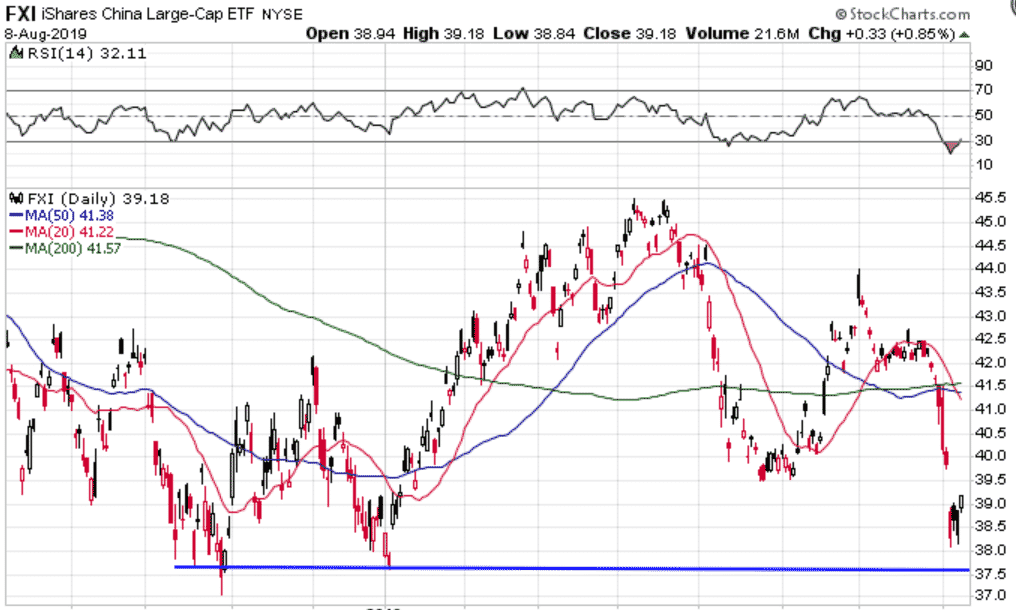
FXI
Getting down to an interesting level from a value persepective. Nasty downtrend though.
ENERGY
Energy has been killed lately and on a relative basis is getting down to 2000 levels. Time for a bounce back soon?

If you’ve got any other charts of interest, let me know.
Trade safe!
Disclaimer: The information above is for educational purposes only and should not be treated as investment advice. The strategy presented would not be suitable for investors who are not familiar with exchange traded options. Any readers interested in this strategy should do their own research and seek advice from a licensed financial adviser.


